Running Samples
NovoCyte Quanteon Flow Cytometer Operator's Guide 87
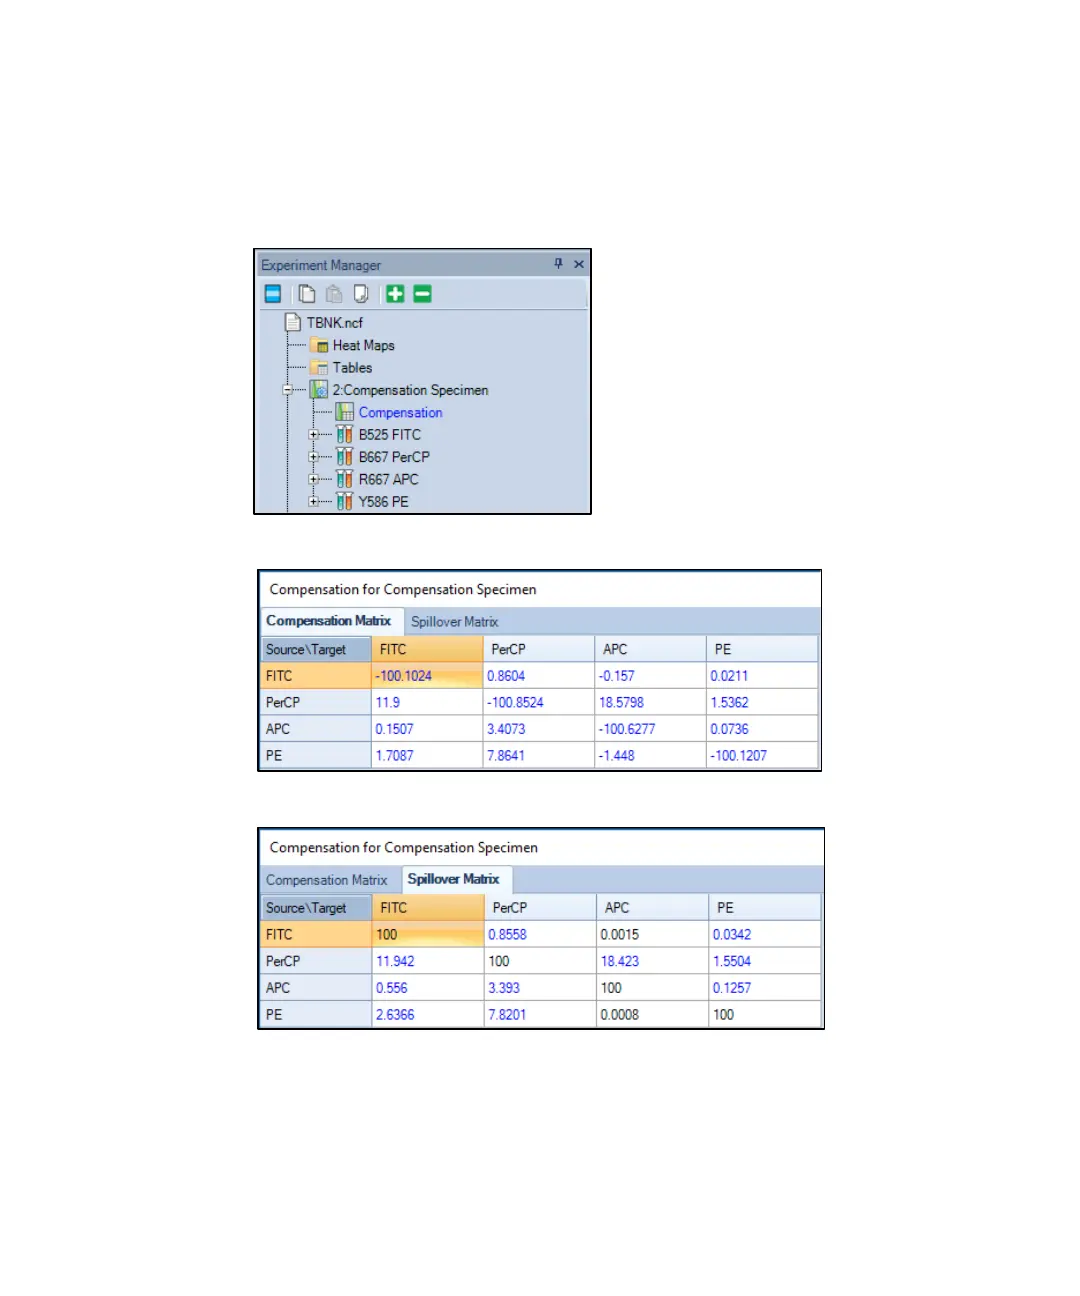
values (Figure 53). You can then view the Compensation Matrix (Figure 54) and
Spillover Matrix (Figure 55) by double-clicking Compensation under the
Compensation Specimen node in the Experiment Manager.
Figure 53. Double-click Compensation to View the Compensation Matrix
Figure 54. Compensation Matrix Generated by Auto Compensation
Figure 55. Spillover Matrix Generated by Auto Compensation
5 Apply Compensation Matrix to Experimental Samples
There are two ways to apply the automatically generated compensation matrix to
the experimental samples. The first method is to copy and paste the
 Loading...