Running Samples
NovoCyte Quanteon Flow Cytometer Operator's Guide 97
The fluorescence signal may become negative after compensation, which is
problematic to display using a logarithmic scale. To address this issue, the
NovoExpress software provides a Bi-Exponential Transform for data scaling. Right-
click the axes on the density plot and select Biexponential as the plotting scale.
Please refer to the NovoExpress Software Guide for details about the biexponential
transform.
The biexponential scale will take more computer resources for plotting and thus
may lead to slower refreshing speed for the displayed data, especially when the
number of the events is large. When this occurs, using the logarithmic scale may
help to improve the data refreshing speed during the compensation process. After
the compensation adjustment is done, switch back to biexponential scale to have a
better visualization of the data.
Analyze Data
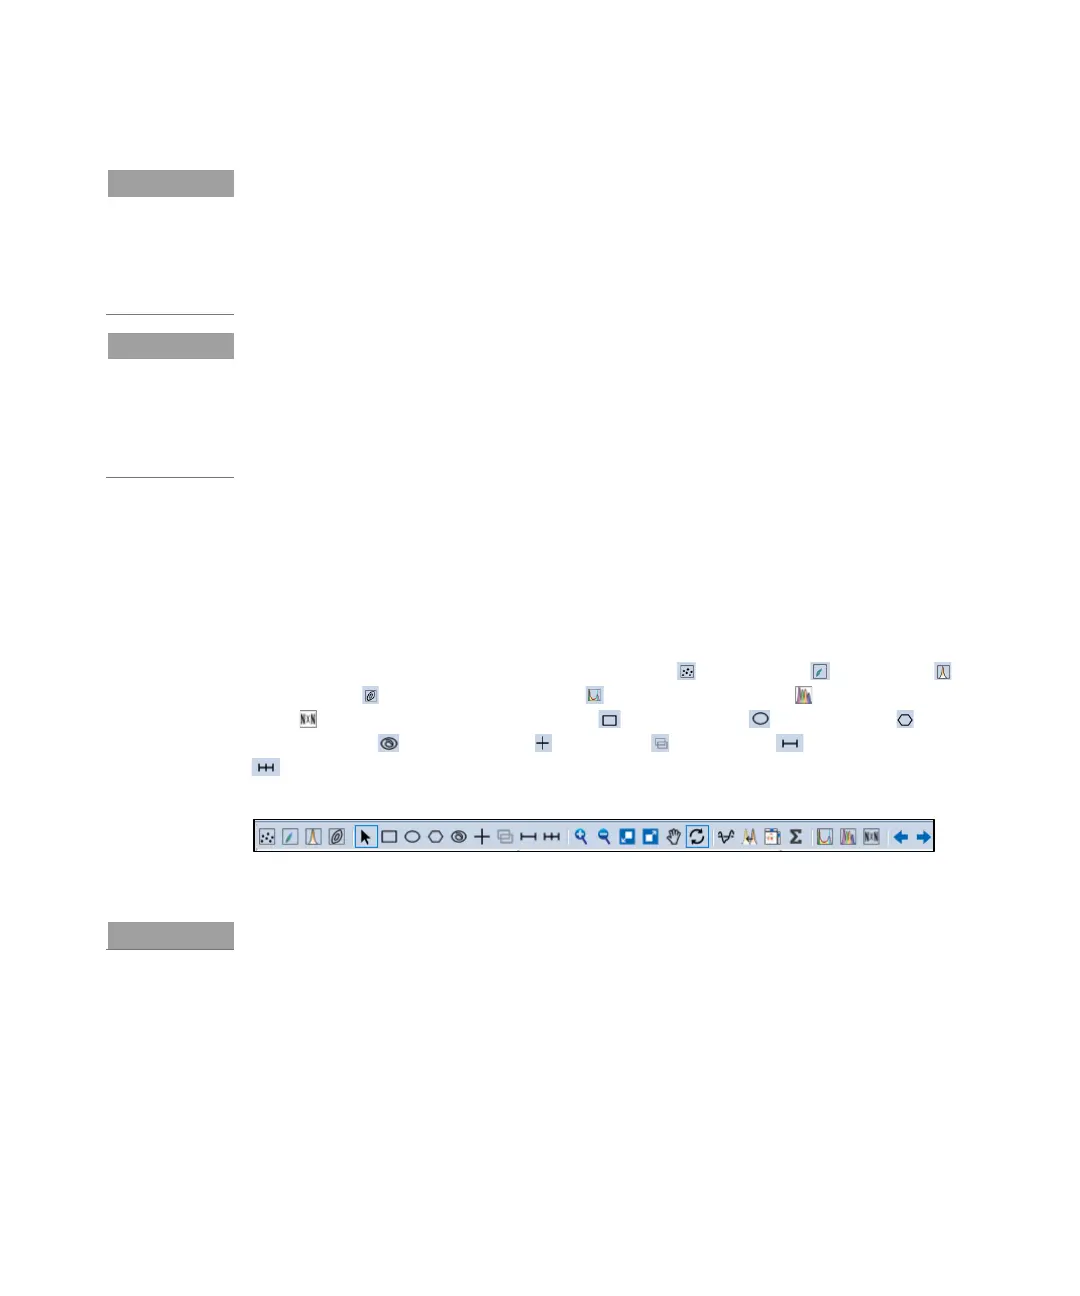
The NovoExpress software provides a variety of plots and gates for flow cytometry
data analysis. The type of plots includes dot plot , density plot , histogram ,
contour plot , cell cycle analysis plot , cell proliferation plot , and bi-variate
plots . Gates include rectangular gate , elliptical gate , polygon gate ,
freehand gate , quadrant gate , logic gate , range gate , and bi-range gate
. By clicking the icon in the NovoExpress software data analysis toolbar (Figure
70), you can create the corresponding plot and gate.
Figure 70. NovoExpress Software Data Analysis Toolbar
Please refer to NovoExpress Software Guide for details about plots and gates.
Data analysis can be conducted during or after the sample acquisition. In this
guide, commonly used data analysis methods and procedures will be described
using the CD3 FITC/CD8 PE/CD45 PerCP/CD4 APC stained human peripheral
blood sample as an example. The general methods apply to the other data
analysis as well.
• Set Sample as Active Sample
 Loading...