Running Samples
96 NovoCyte Quanteon Flow Cytometer Operator's Guide
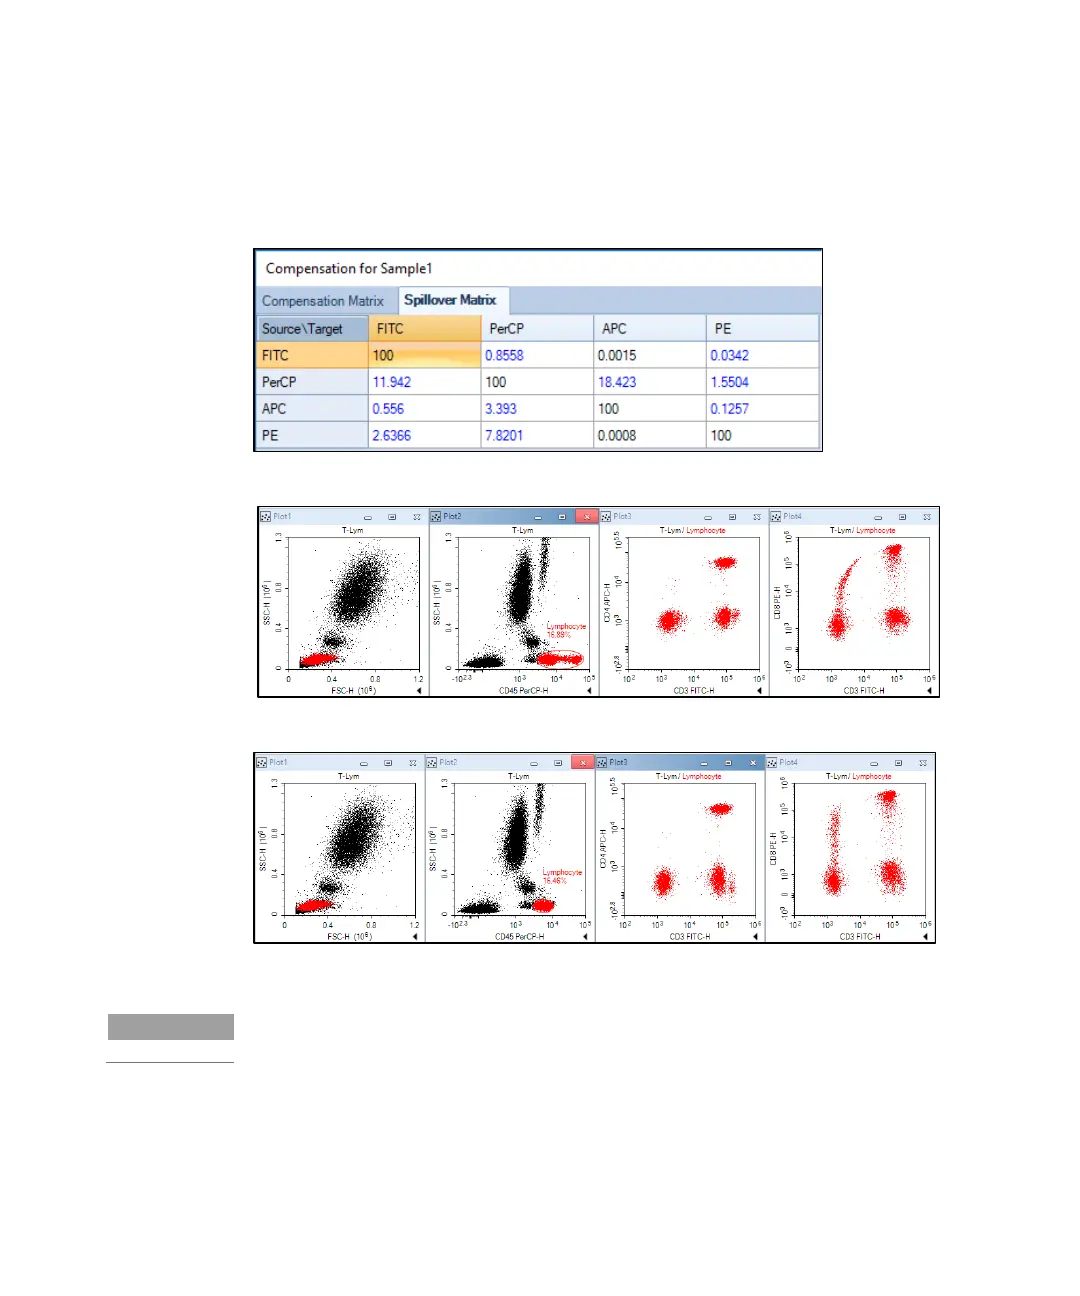
a template and may be applied to the other experimental samples. Figure 68 and
Figure 69 shows the results of the T-Lym sample before and after the
compensation, respectively.
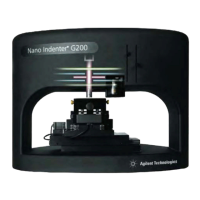
Figure 67. Incorporate the Spillover Coefficients from Single-Stained Samples into the Spillover Matrix
Figure 68. Results of T-Lym Sample: Before Compensation
Figure 69. Results of T-Lym Sample: After Compensation

 Loading...