PN 9000-165-VE, Rev P
Trend Logging
Plotting Data Using the Candlestick Format
When plotting the data for trend logging, the AMEVision software uses a
“candlestick” method to format the trending. This method allows more data
to be plotted than there is space available on your display giving you more in-
sight into how your analyzer is operating. It is also a useful tool for the techni-
cian who can see weeks and months of data to determine more easily at what
point a problem occurred or to use the data to head o a potential problem.
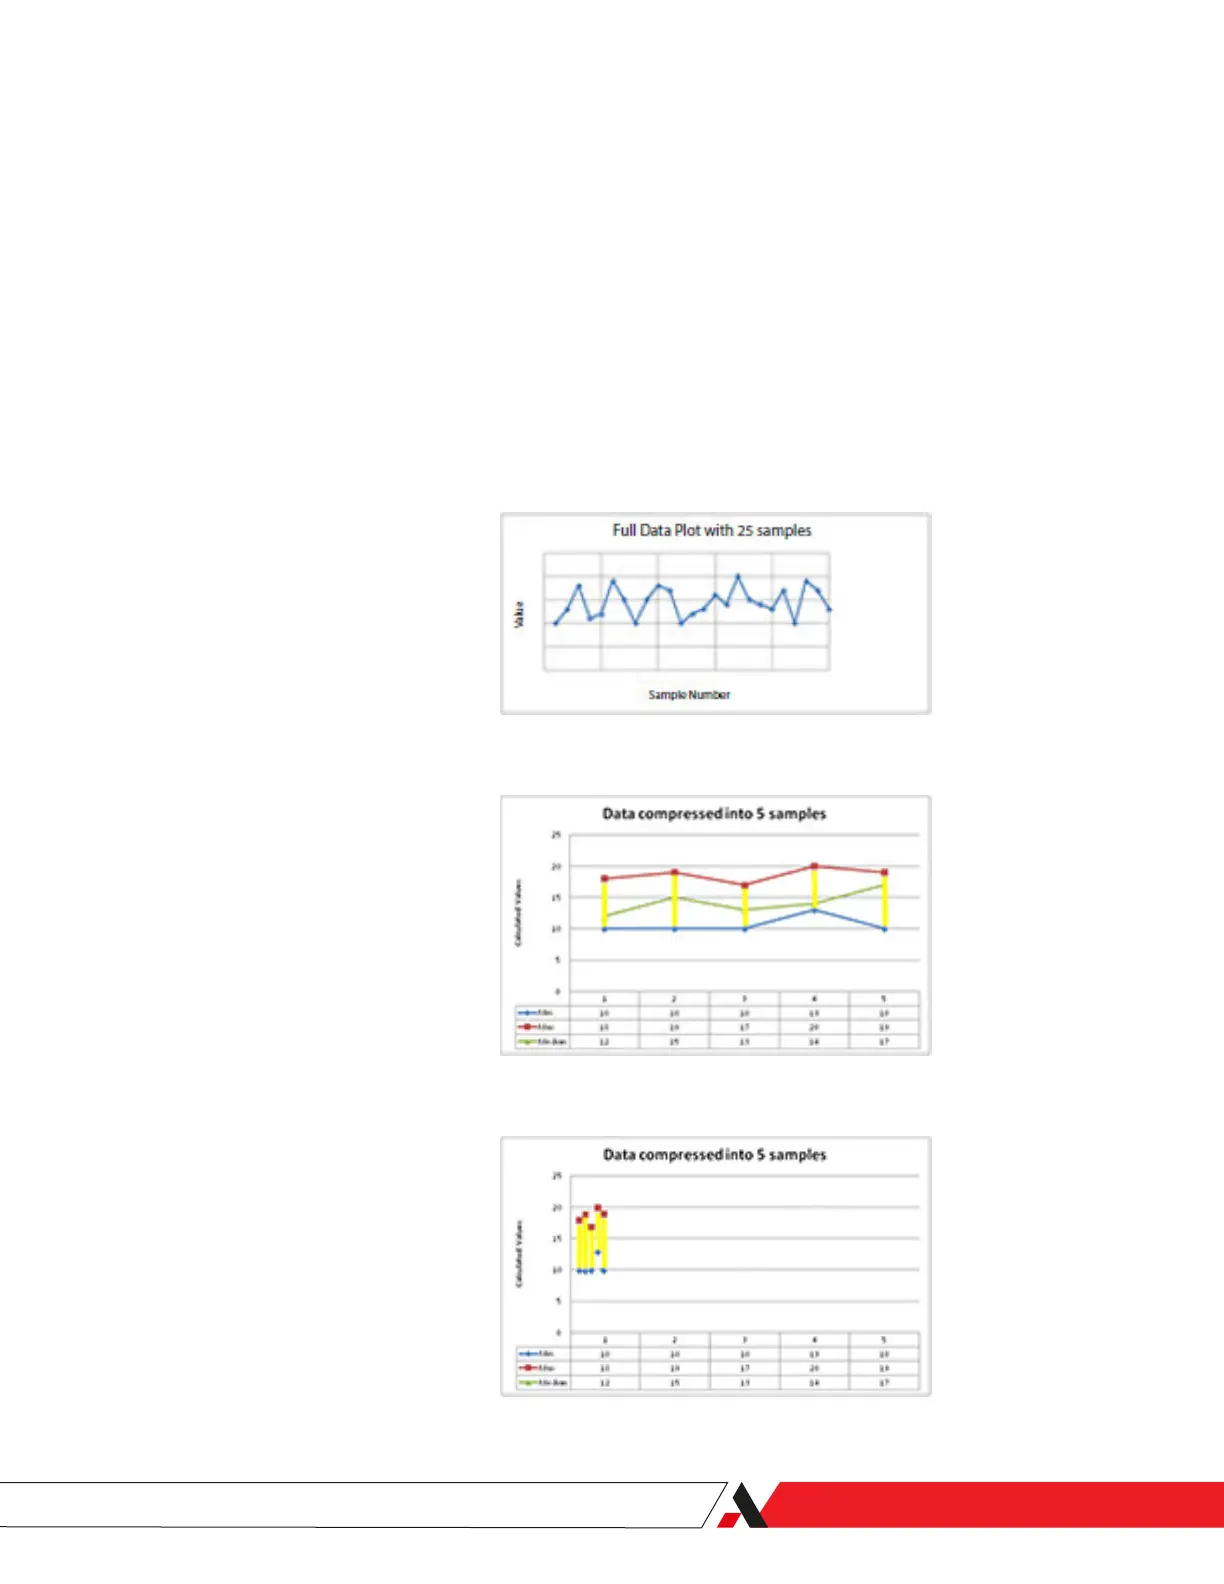
The candlestick method takes the minimum and maximum of each range of
sample data and produces a vertical yellow line – called a candlestick – to rep-
resent the sample range’s minimum and maximum data sets.
Figure 3-5.1.
Trend data for 25 samples.
Figure 3-5.2.
Trend data compiled with
minimum and maximum data
sets.
Figure 3-5.3.
Candlestick data for the same
time period.
Alarms and Warnings | 3-7
 Loading...