M19-2101 REVISION 2.0 DVNEXT RHEOMETER - OPERATIONAL MANUAL
is applied. As a result, the ow curve intersects the y-axis at a point greater than 0. After yielding, the
product creates a ow curve and behaves as a Power Law uid so that n indicates where there is a
shear-thinning or shear-thickening tendency. (In this case, if n =1, the material is behaving as a Bing-
ham uid, which is discussed next.)
An Example of the Herschel-Bulkley Model at Work
A company uses a gel-like substance as part of their
production process. Upon arrival they test the material
and apply the Herschel-Bulkley model to ensure it will
perform correctly during process. The results in Figure
6-2 show that the consistency index is 9,081 cP, the flow
index is 0.656 and the yield stress is 54.3 dynes/cm
2
.
These results indicate that this batch of gel does not
quite meet specification. While the consistency index is
within spec, the yield value is higher than normal so the
fluid will not begin to flow as easily. With a flow index of
0.66, this batch is also less shear thinning than normal.
Pump and mixer speeds must be adjusted before using
this material.
Gel-Like substance
𝑛 = 0.656
τ
0
= 54.3 dynes/cm
2
𝐾 = 9081 cP
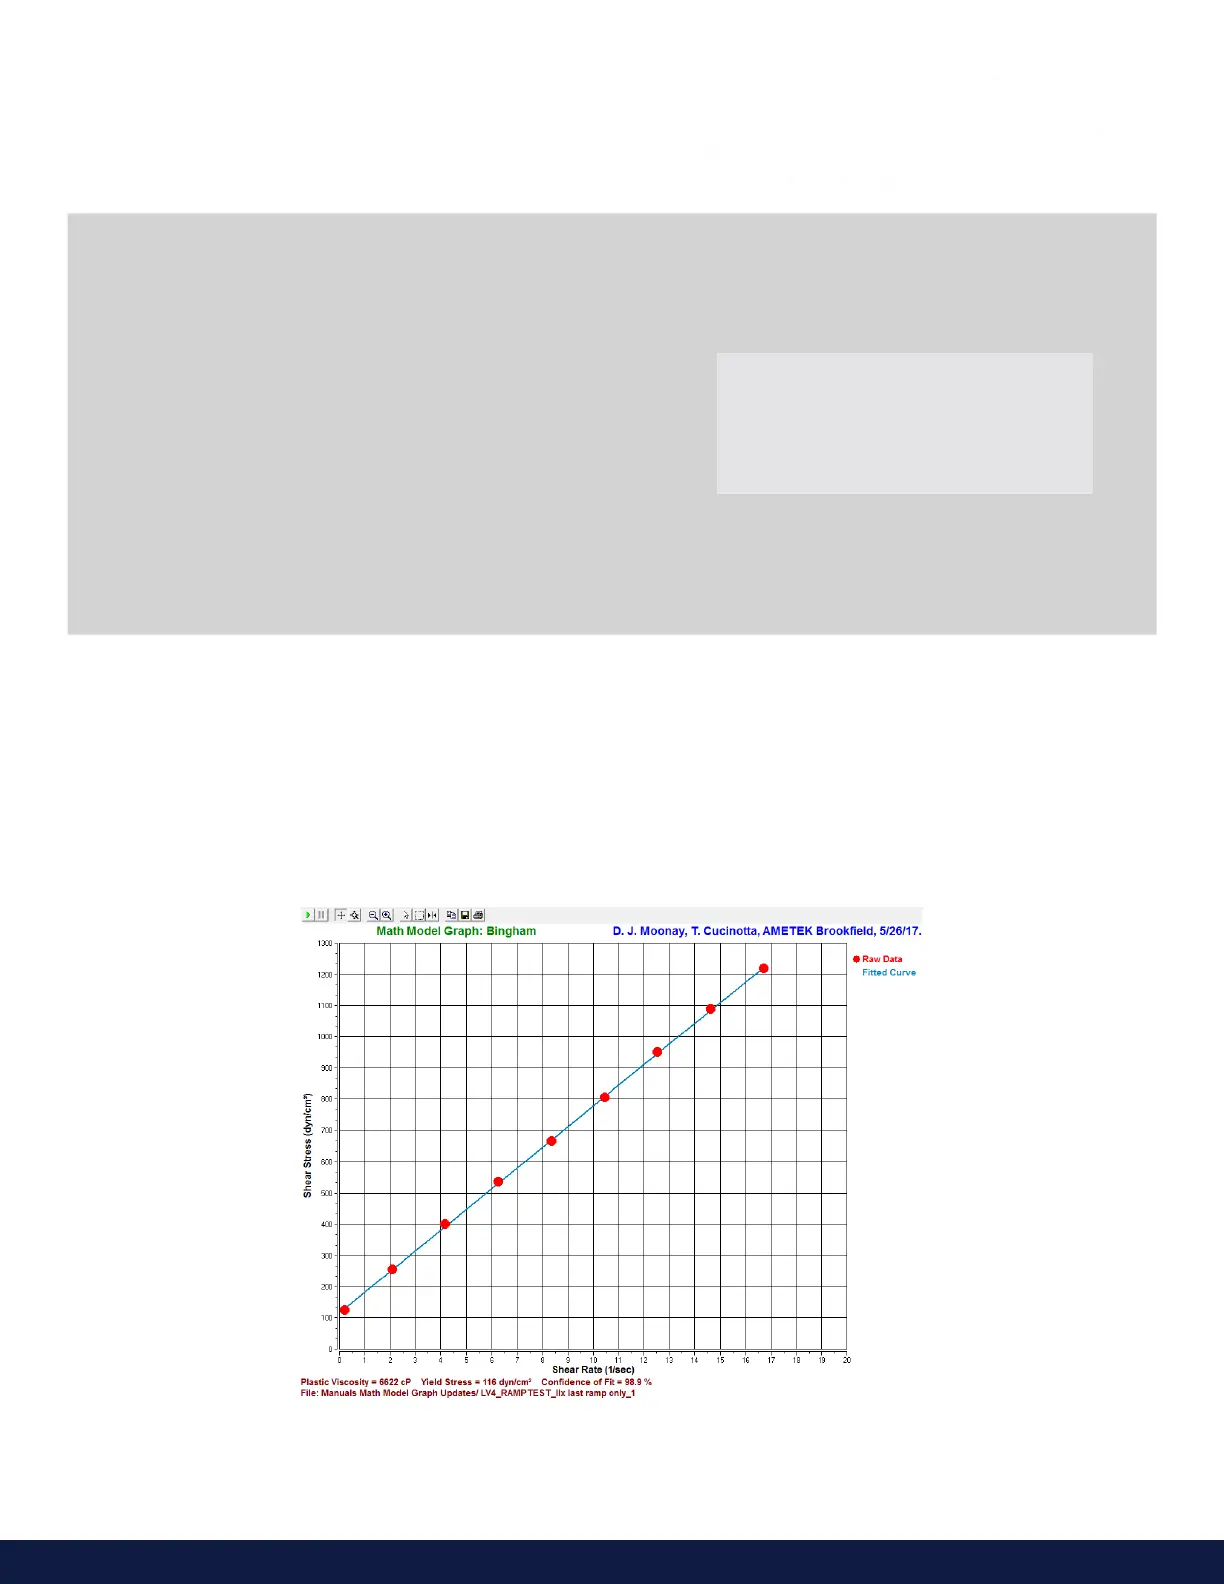
6.3 The Bingham model
τ=τ
0
+ 𝐾𝛾 𝑛 (τ= shear stress, τ
0
0 = yield stress, 𝐾 = consistency index, 𝛾= shear rate, and 𝑛 = flow index)
When Should you use it?
The Bingham model indicates a product’s yield stress, which is the amount of shear stress required to initiate flow. It
also provides the plastic viscosity, η, which is the viscosity after a product yields.
Figure 6-3

 Loading...