Patient monitor User’s manual
Chapter 7-11
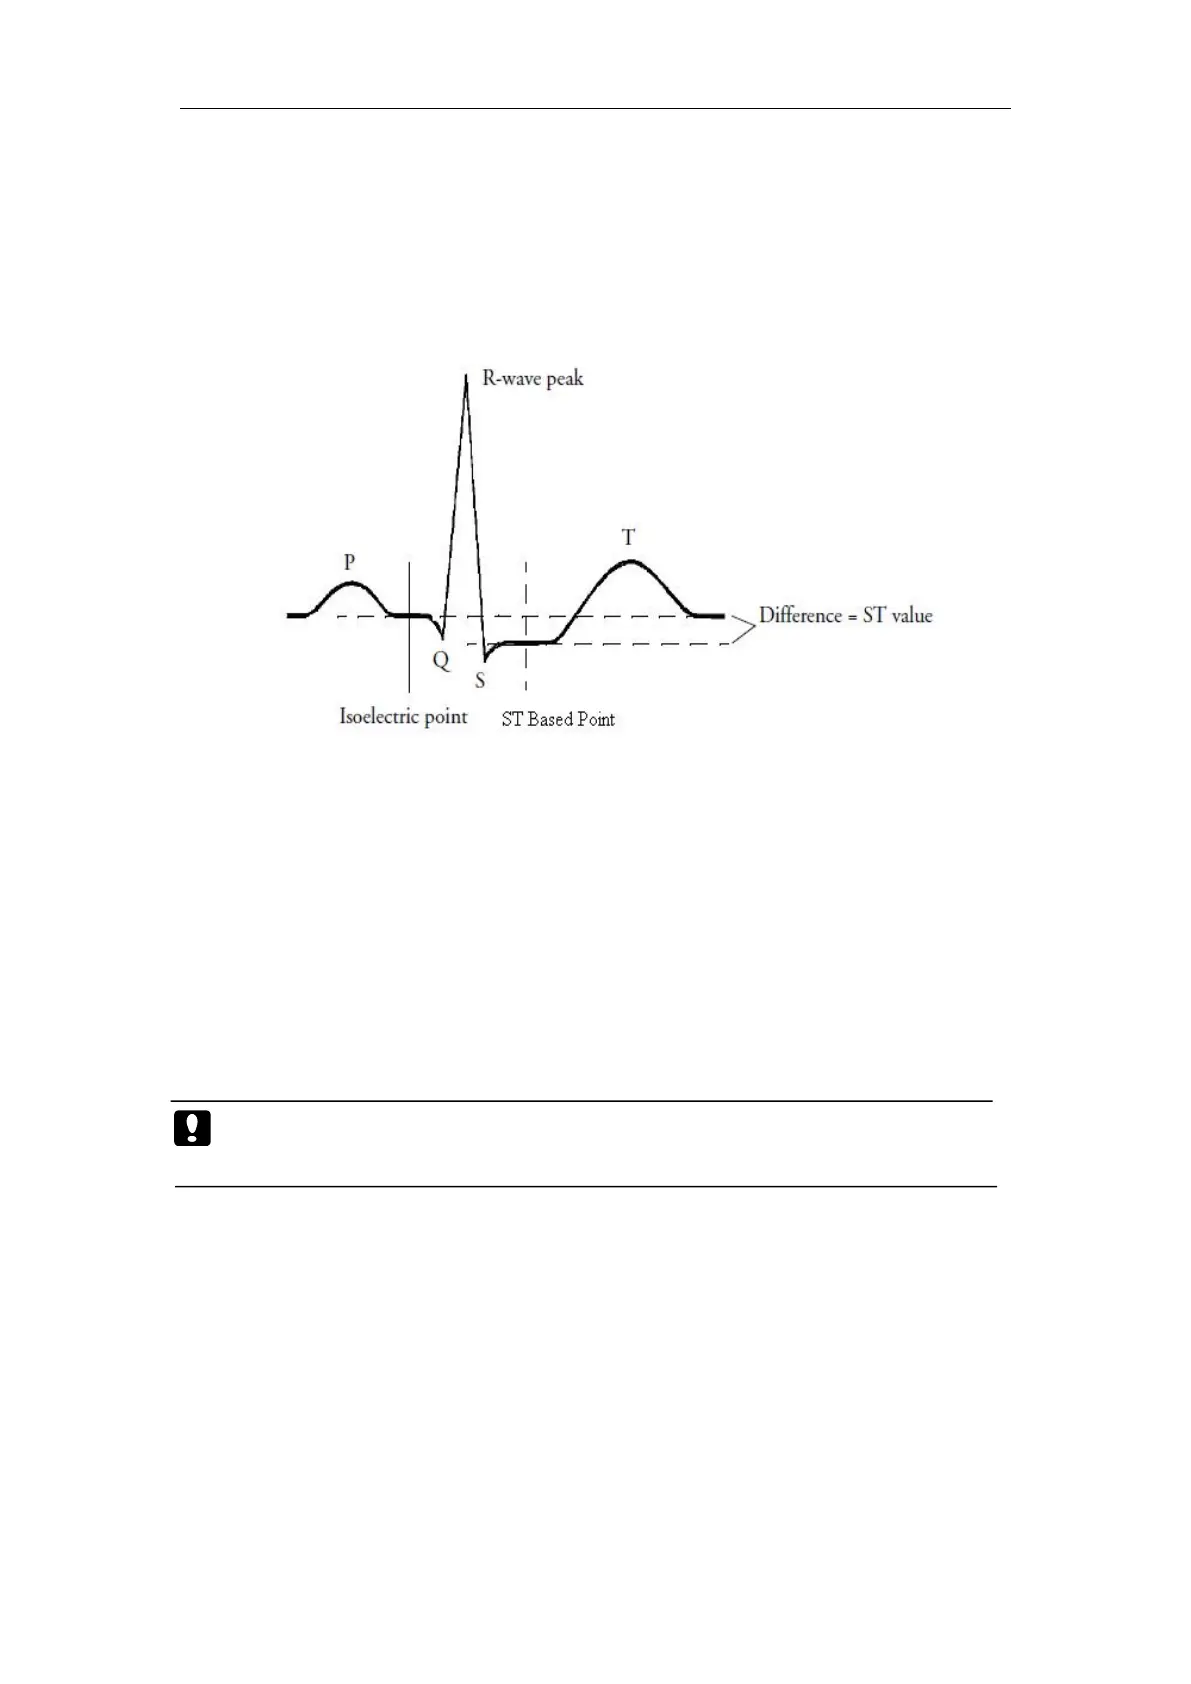
The ST value for each beat complex is the vertical difference between the
ISO point and the ST point, as shown in the figure below. The isoelectric (ISO)
point provides the baseline, the ST point is at the midpoint of the ST segment.
In the ST analysis menu, select
【
Adjust ST point
】
, the QRS complex
will be displayed on the popped up window, the two vertical lines indicate
the position of ISO point and ST point. Set the R wave peak as the reference
point for ST measurement.
The ST measurement points and ISO point need to be adjusted when you
start monitoring, and if the patient's heart rate or ECG morphology changes
You can select【ISO】or【ST】and then adjust the point right and left.
Caution: When conducting ST analysis, the system will not consider
The monitor can derive a ST portrait from the ST analysis (ST map), that
can help you to detect the changes in ST values.
If you want to view the ST map, click the ECG parameter area,and select
the【ST map】.