Chapter 5 Analyze the Experiment
View the QC Summary
Applied Biosystems 7500/7500 Fast Real-Time PCR System Getting Started Guide for Standard Curve
Experiments
88
Notes
View the QC Summary
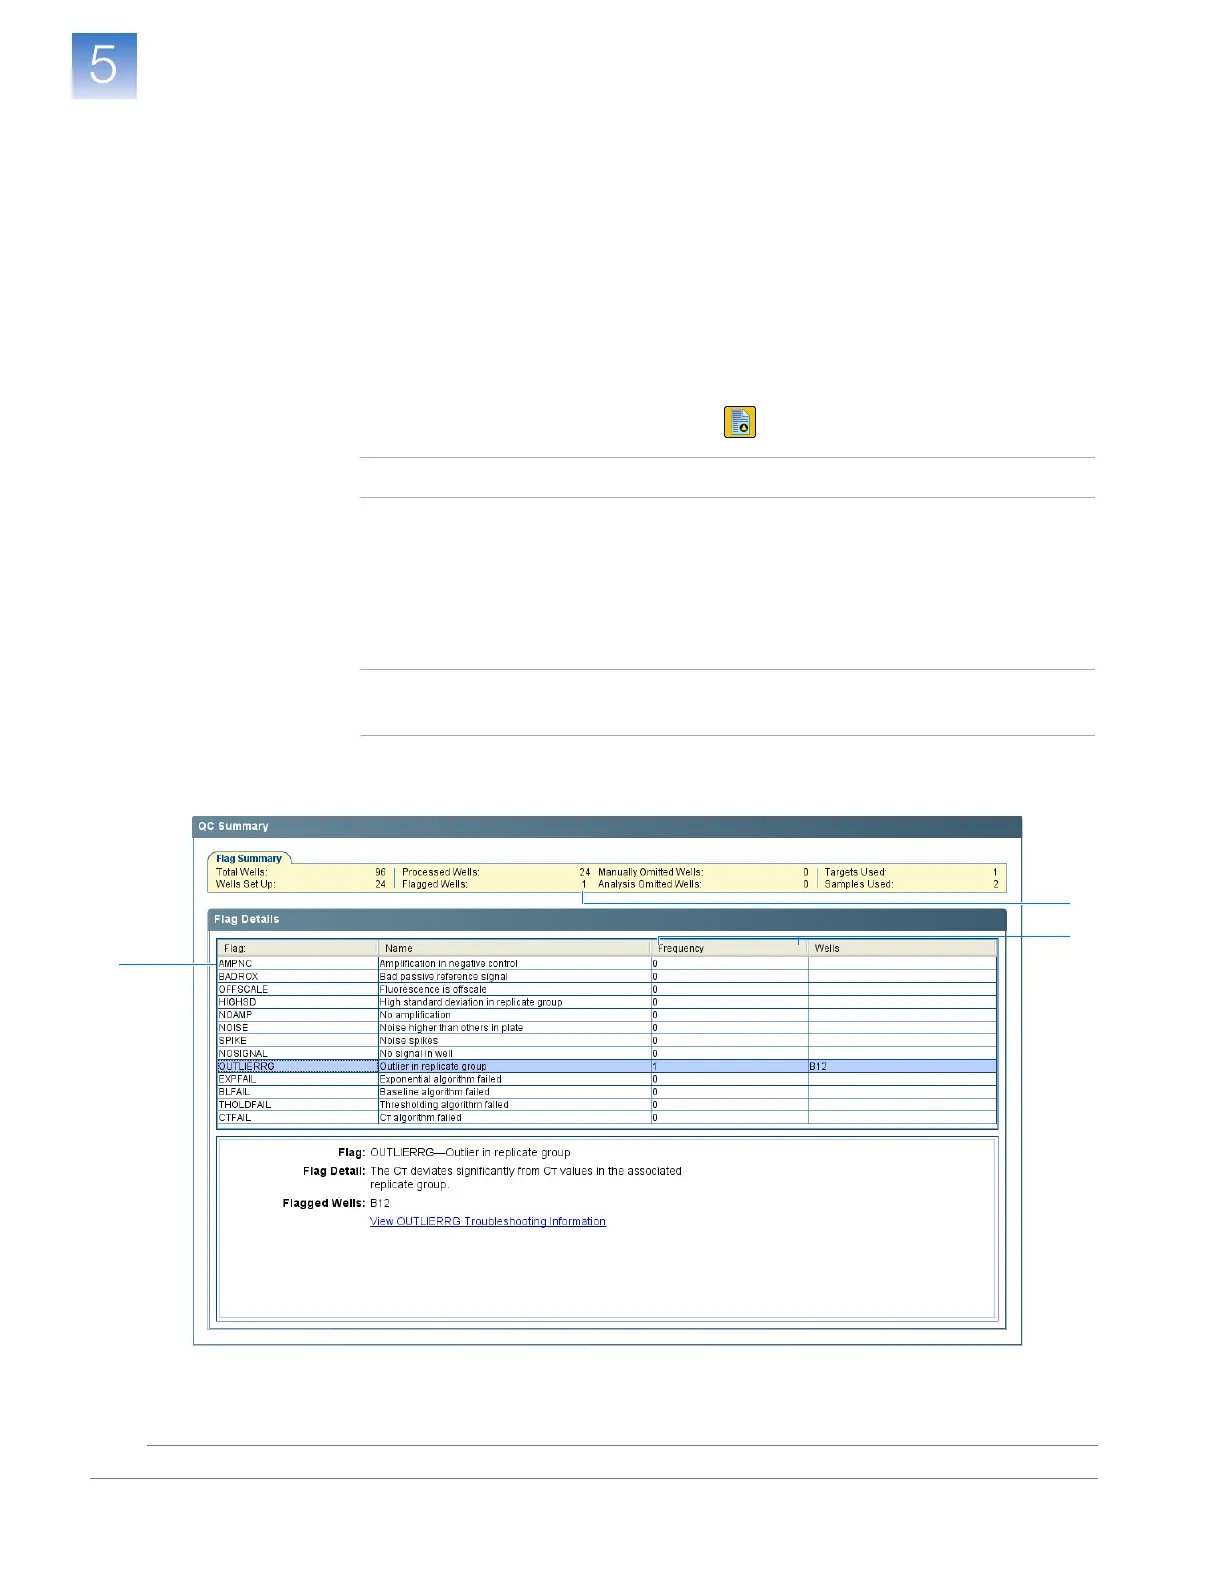
The QC Summary screen displays a list of the 7500 software flags, and includes the flag
frequency and location for the open experiment.
About the
Example
Experiment
In the standard curve example experiment, you review the QC Summary screen for any
flags generated by the experiment data. In the example experiment, well B12 produced a
C
T
that deviates significantly from the associated technical replicates, generating the
OUTLIERRG flag and indicating that the well is a potential outlier.
View the QC
Summary
1. In the navigation pane, select Analysis QC Summary.
Note: If no data are displayed, click Analyze.
2. Review the Flag Summary. In the example experiment, there is 1 flagged well.
3. In the Flag Details table, look in the Frequency and Wells columns to determine
which flag appears in the experiment. In the example experiment, the Frequency
column displays 1 for the OUTLIERRG flag.
Note: A 0 that is displayed in the Frequency column indicates that the flag does not
appear in the experiment.
4.
(Optional) Click the OUTLIERRG flag row to display details about the flag.
2
3
4