Chapter 5 Analyze the Experiment
Analyze the Experiment
Applied Biosystems 7500/7500 Fast Real-Time PCR System Getting Started Guide for Standard Curve
Experiments
68
Notes
Analyze the Experiment
The 7500 software analyzes the experiment and displays results in the analysis screens
(for example, the Amplification Plot screen, QC Summary screen, and so on).
About the
Example
Experiment
For the standard curve example experiment, use the data file that is installed with the
7500 software. The data file was created with the same design parameters that are
provided in Chapter 2, then run and analyzed on a 7500/7500 Fast instrument. You can
find the data file for the example experiment on your computer at:
<drive>:\Applied Biosystems\<software name>\experiments\
Standard Curve Example.eds
where:
• <drive> is the computer hard drive on which the 7500 software is installed.
• <software name> is the current version of the 7500 software.
Analyze the
Example
Experiment
1. Double-click (7500 software) or select StartAll Programs Applied
Biosystems7500 Software<software name>
where <software name> is the current version of the 7500 software.
2. In the Home screen, click Open.
3. In the Open dialog box, navigate to the experiments folder at:
<drive>:\Applied Biosystems\<software name>\experiments
4. Double-click Standard Curve Example.eds to open the example experiment data
file.
Note: The experiments folder contains several data files; be sure to select Standard
Curve Example.eds.
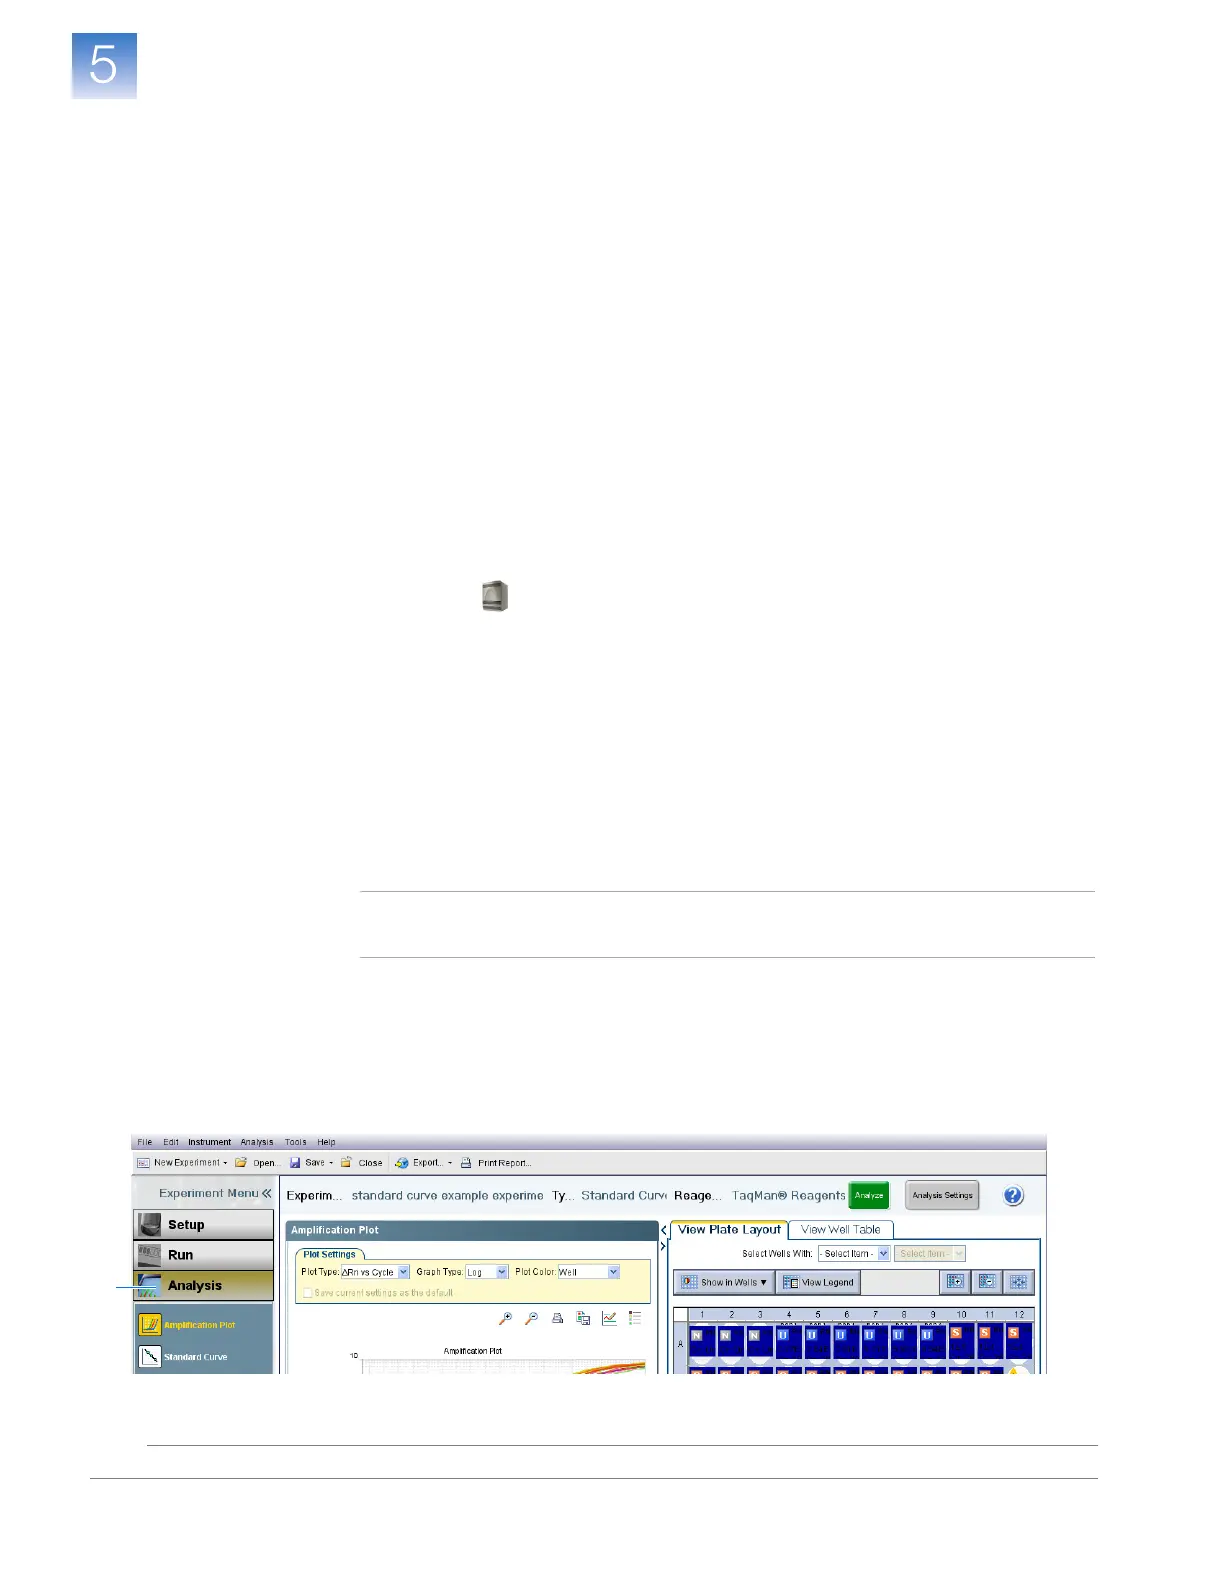
5. In the navigation pane, click Analysis. The 7500 software analyzes the data using
the default analysis settings.
See “Navigation Tips” on page 69 for information on navigating within the analysis
screens.
5