Chapter 5 Analyze the Experiment
Analyze the Experiment
69
Applied Biosystems 7500/7500 Fast Real-Time PCR System Getting Started Guide for Standard Curve
Experiments
Notes
Guidelines
When you analyze your own standard curve experiment:
• Immediately after a run, the 7500 software automatically analyzes the data using the
default analysis settings, then displays the Amplification Plot screen on your
computer.
• To reanalyze the data, select all the wells in the plate layout, then click Analyze.
Navigation Tips
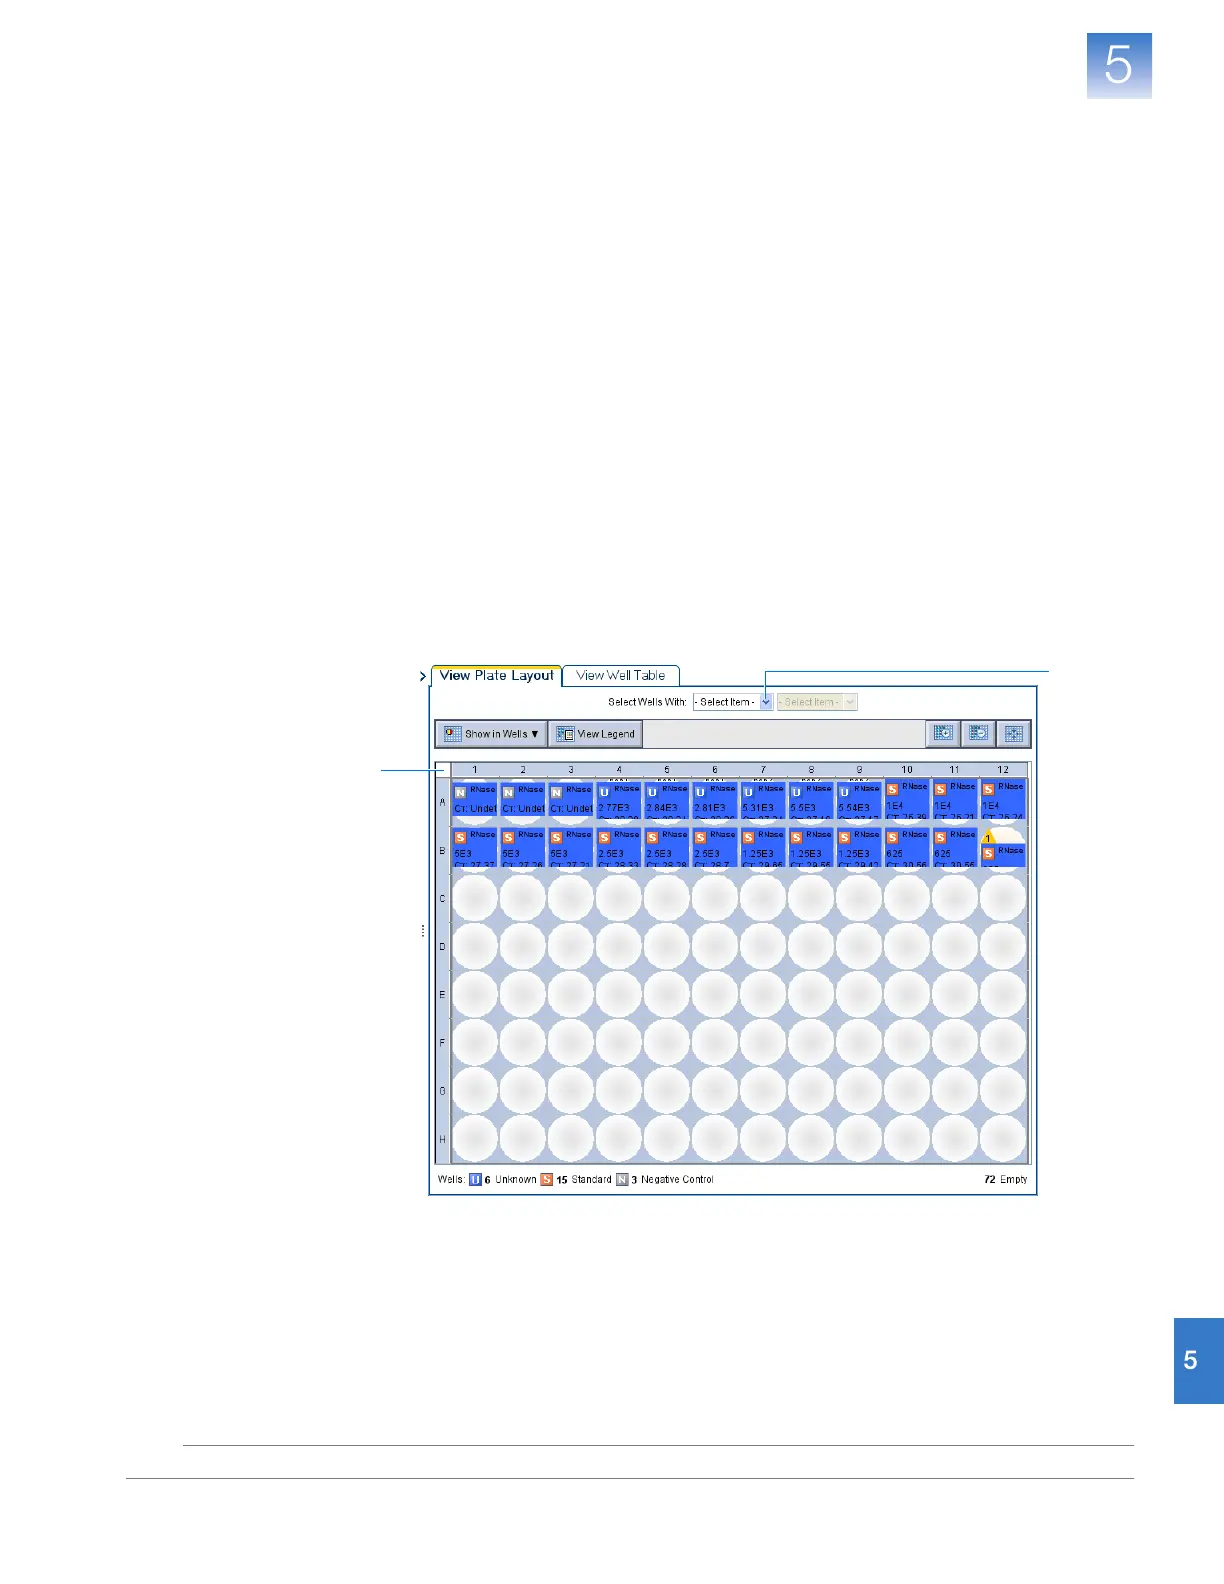
How to Select Wells
To display specific wells in the analysis screens, select the wells in the View Plate Layout
tab as follows:
1. To select wells of a specific type, using the Select Wells With drop-down lists, select
Sample, Target, or Task, then select the sample, target, or task name.
2. To select a single well, click the well in the plate layout.
3. To select multiple wells, click-drag over the desired wells, or CTRL+click, or
Shift+click the desired wells in the plate layout.
4. To select all 96 wells, click the upper left corner of the plate layout.
1
4