Chapter 5 Analyze the Experiment
View the Standard Curve
Applied Biosystems 7500/7500 Fast Real-Time PCR System Getting Started Guide for Standard Curve
Experiments
72
Notes
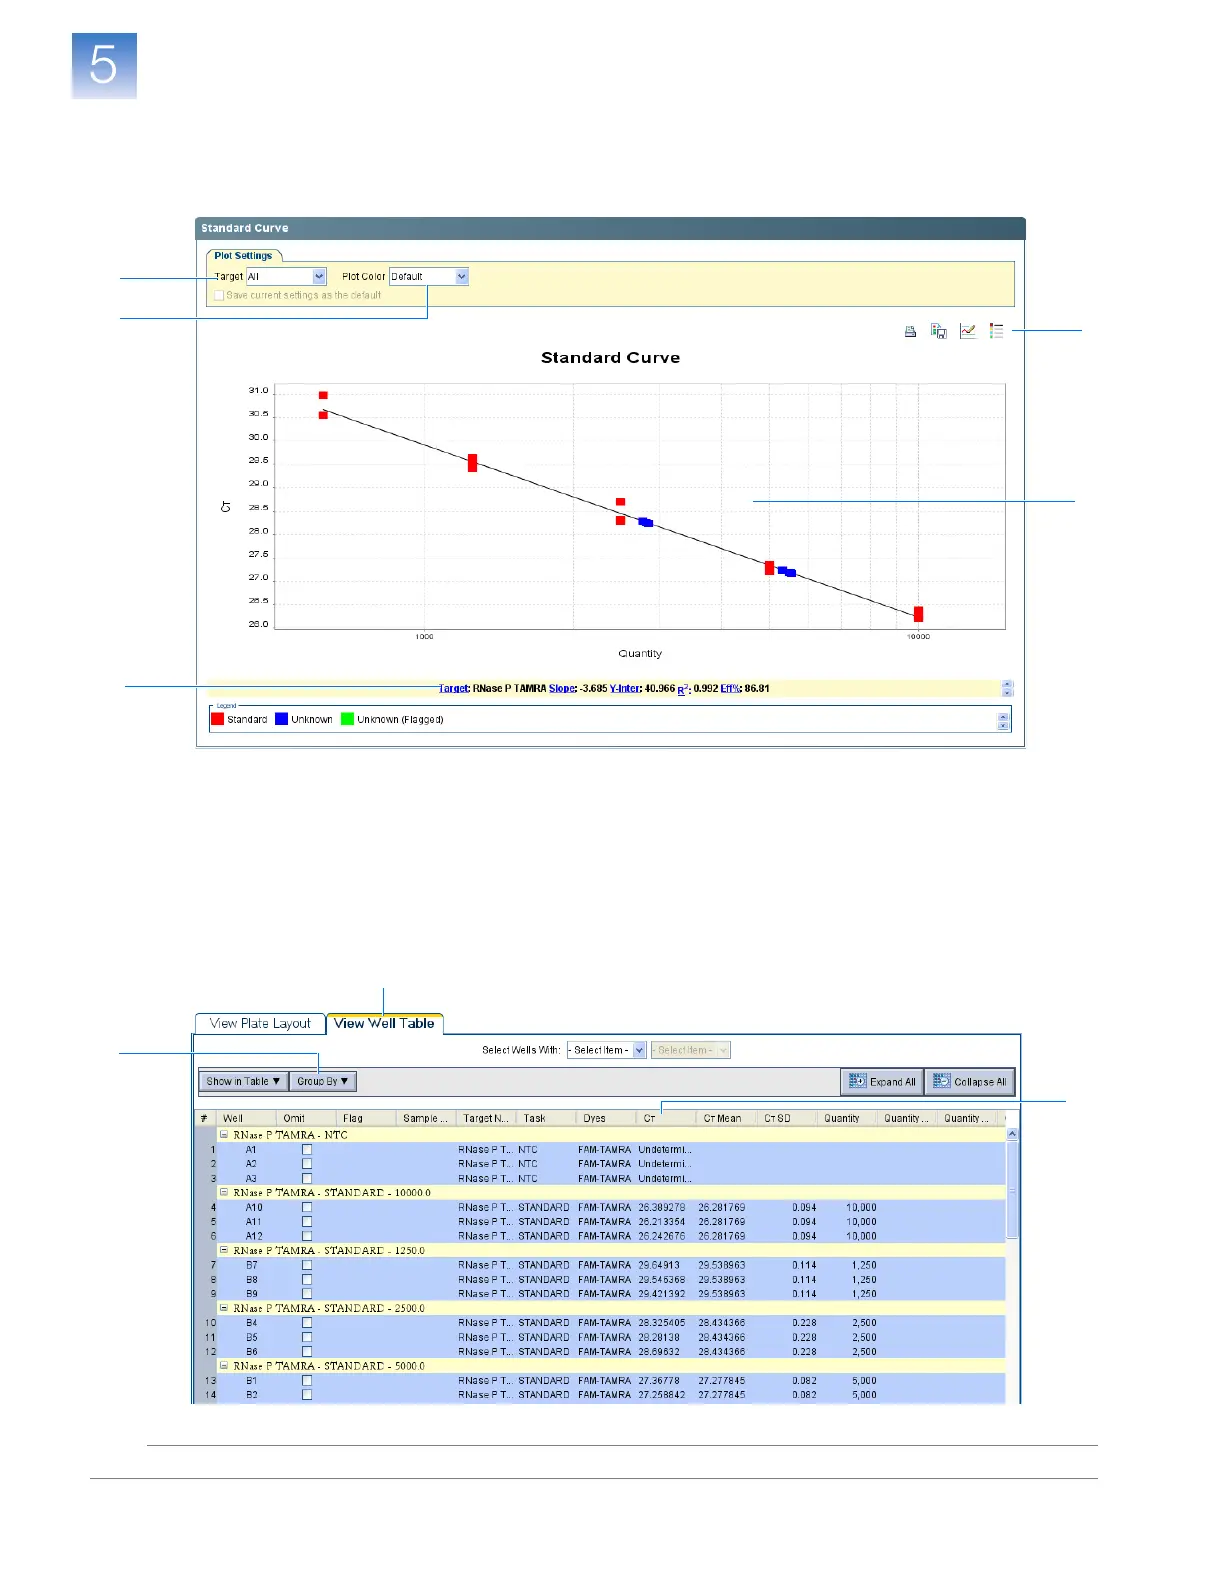
7. Check that all samples are within the standard curve. In the example experiment, all
samples (blue dots) are within the standard curve (red dots).
8. Check the C
T
values:
a. Select the View Well Table tab.
b. In the Group By drop-down list, select Replicate.
c. Observe the values in the C
T
column. In the example experiment, the C
T
values
are within the expected range (>8 and <35).
6
5
7
3
4
8b
8a
8c