Chapter 6 Analyzing Data in an RQ Study
Creating an RQ Study Document
62 Applied Biosystems 7300/7500/7500 Fast Real-Time PCR System Relative Quantification Getting Started Guide
Notes
6. Click Finish. If desired, save the RQ Study
document when prompted.
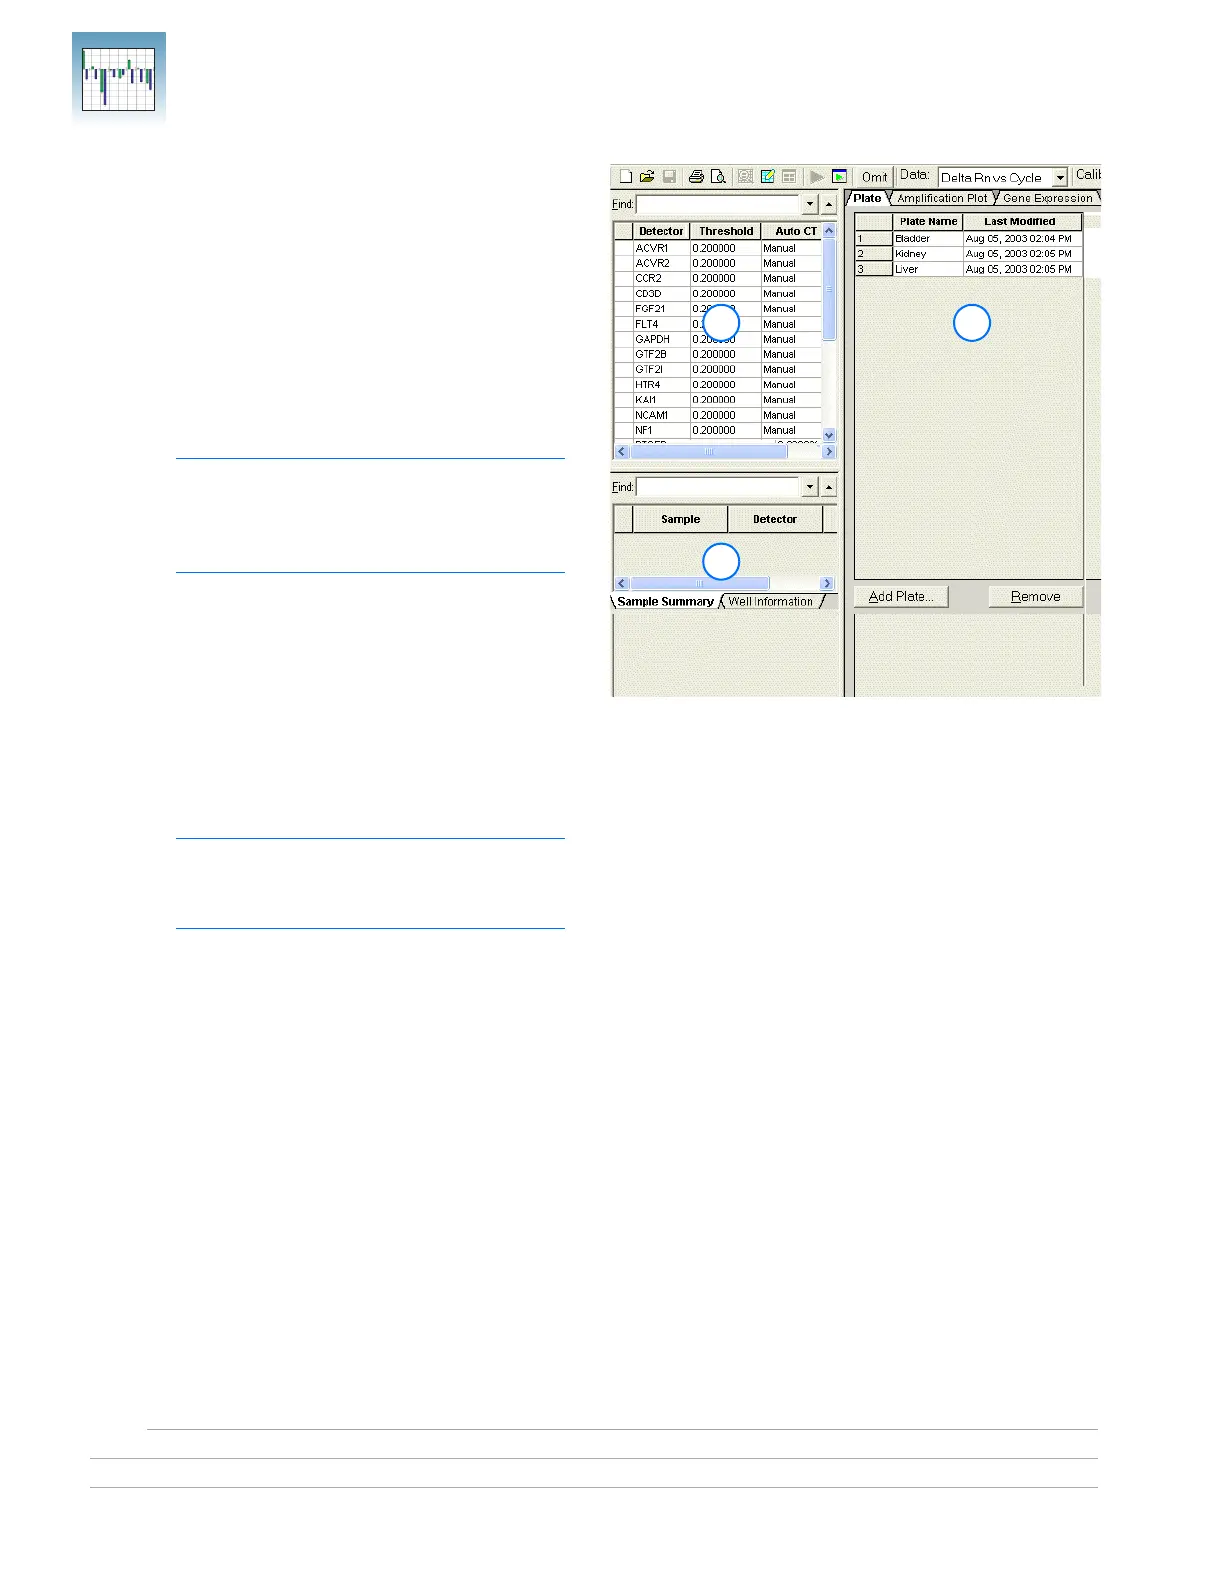
The SDS Software 1.3.1 opens a new RQ Study
document and displays the RQ Study main view
with its three panes:
a. RQ Detector grid – Allows you to select
detectors to associate with the loaded study.
For each detector, Color, Detector name,
Threshold value, Auto Ct, and Baseline are
displayed.
Note: At this point, all the values in the
Threshold, Auto Ct, and Baseline columns
are set to the default values (0.200000,
Manual, and [6,15], respectively).
b. RQ Sample grid – Displays the samples
associated with the selected detector(s). The
Sample Grid displays numerical results of
RQ calculations and has two subtabs:
Sample Summary and Well Information.
c. RQ Results panel – Contains the three
results-based tabs: Plate (default),
Amplification Plot, and Gene Expression.
Note: You can save the RQ Study
document now, or wait until after specifying
analysis settings and analyzing the data.
6a
6b
6c