Density Meter LB 444 SECTION 2. SYSTEM DESCRIPTION
14
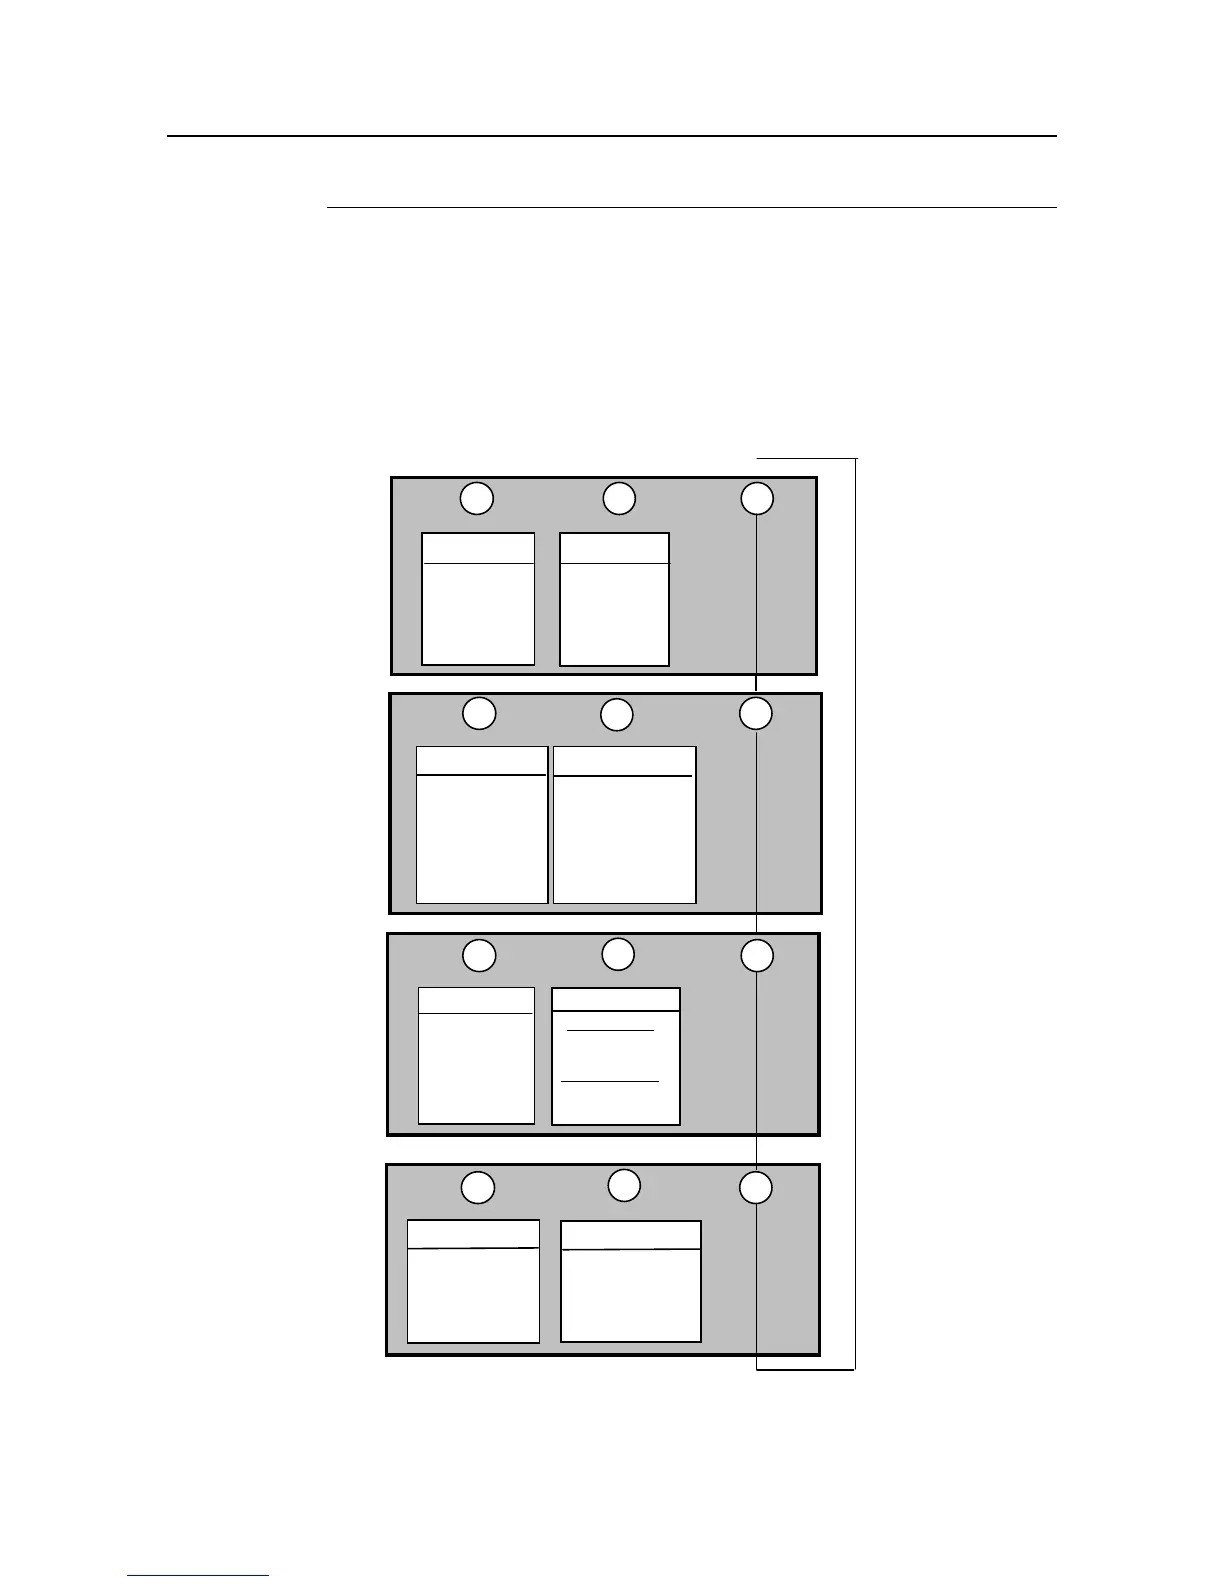
2.4.1.6 Menu Structure (Flow Chart)
The flow chart below shows in a simplified way the menu structure for parameter
input and operation. With <
more
> you select the various menu groups and from
there you get to the respective menu with <
sk1
> or <
sk2
>. Within the menu you
get to the individual windows with <
more
> and at the end of the menu you get
back to the menu group with <
done
>. For a complete overview of the menu
structure see the appendix to this manual.
↓
↓
↓
Parameter
Isotope
Time Constant
Rapid Switch-Over
Rad. Interference
Maximum Rate
Minimum Rate
Product Data
Product Selection
Curr. output Limits
Current outp. error
Relay 2 + 3 Setup
Solids density
↓↓
sk2
sk1
more
Productselect
↓
sk2
sk1
more
Service menu
↓
Pt100 Adj./Plateau
Test calculation
HV Setting/Status
Adj. Current Out
↓
↓
↓
sk2
Calibrate
Countrate
Massflow display
Density display
Integr. M.
Flow
sk1
more
Product Selection
Calculate
Cal. Mode
Resuls
Data Input
↓
↓
Oper. Mode
Mass flow
Config Instrument
Density / TC
Password
Date & Time
System/ Version
Language
General Data
sk2sk1
more
Error Mode
Print Parameter
Factory Setting
Rad./Backscatter
Interfaces
Liquid density
HV Detector
Live Display
Unit
Range Input
Flow
Counter Interval
Massflow