Fault Location Mode
37
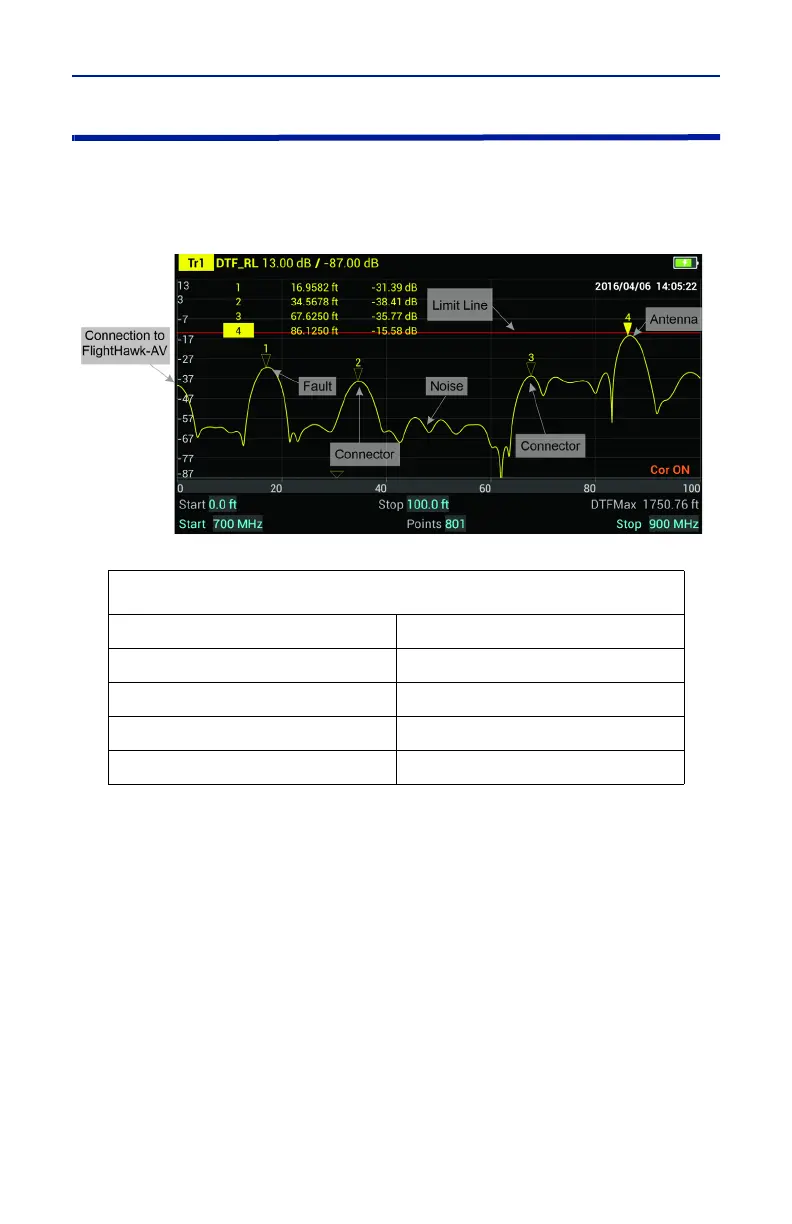
Interpreting the Fault Location Measurement
The graph below shows a typical Fault Location measurement for an antenna
system. The table lists typical component return losses.
Figure 33 Interpreting Fault Location Measurement
Each connector or jumper will show as a spike. If it is larger than the typical
value, check the connector for damage.
Spikes where there are no components represent faults. Note the distance and
check the line at that point for damage.
The largest spike is usually due to the antenna. Typically the trace after the
antenna can be ignored.
Note: If a maximum distance less than the total length of the cable
system is selected, the trace will not show the end of the cable system
(antenna). To display the full cable system always set the maximum
distance to a value that is a few feet or meters greater than the entire
length of the cable system.
A large spike (fault) near the FlightHawk-AV will mask other faults farther away.
When a large spike near the FlightHawk-AV is found, fix it and then repeat the
Fault Location measurement.
Typical Component Return Loss
Antenna at Resonance -14 dB
Connector -25 dB
Jumper -35 dB
Lightning Protector -25 dB
Transmission Line -30 dB