39
Adjustment and commissioning
9.8. Calibrating the full scale
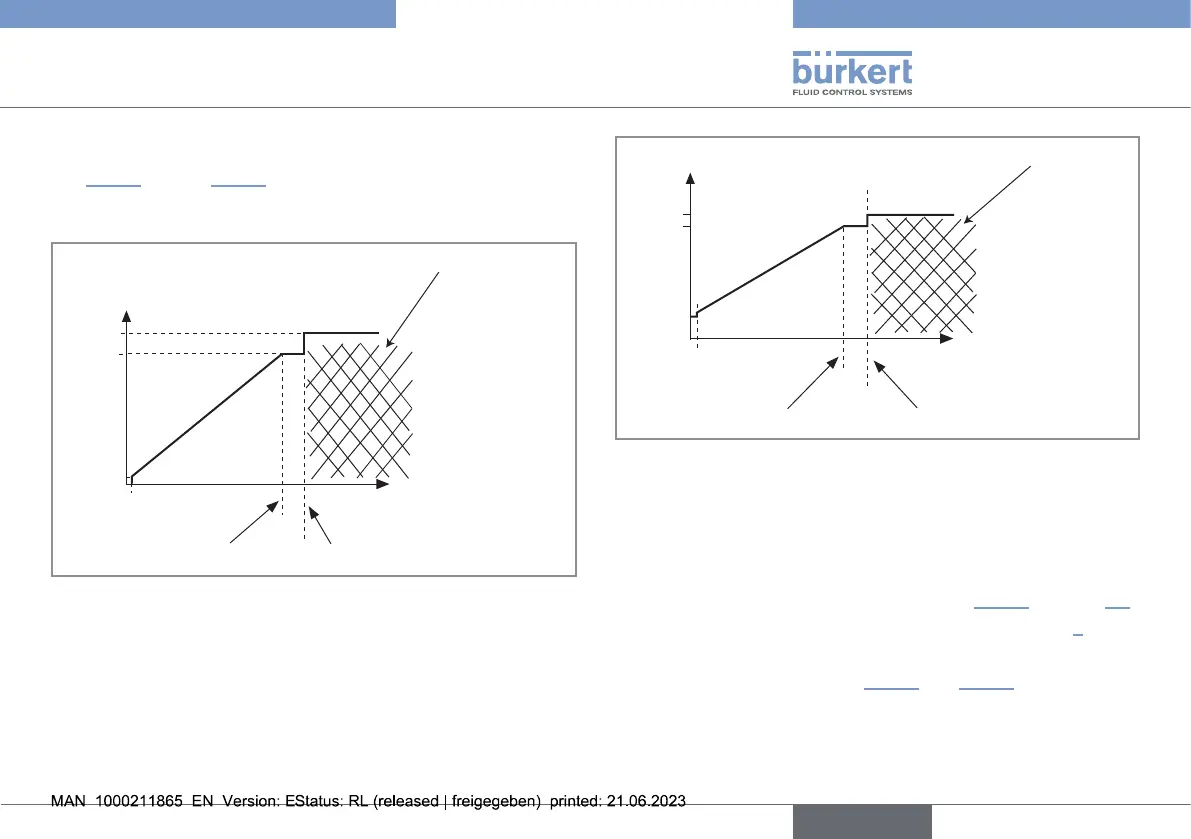
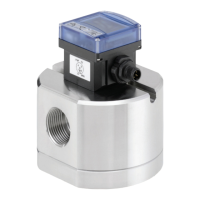
The Fig.29 and the Fig.30 show the relation between the
measured uid velocity and the value of the frequency or current
provided by the outputs.
256
Hz
0
m/s
0.1
240
Full scale error
Calibrated full scale
Full scale +20%
Fig.29: Relationbetweenthemeasureduidvelocityandthe
valueofthefrequencyoutput
22
mA
0
m/s
0.1
20
4
Calibrated full scale
Full scale +20%
Full scale error
Fig.30: Relationbetweenthemeasureduidvelocityandthe
valueofthecurrentoutput
If no predened measuring range is applicable to your process,
the device can be calibrated with the actual max. ow velocity of
the application.
The low bound of the measuring range is 0m/s.
→ Position the switches4 and 5 to ON (see Fig.25, chapter9.2).
→ Install the device on the pipe as described in chapter8.
→ Allow the uid to circulate in the pipe at maximum velocity.
→ Calibrate the full scale, see Fig.31 and Fig.32.
english
Type 8041