Chapter 13: Spreadsheet Application 240
Tip: The contents of the Spreadsheet window [Graph] menu and the Graph window [Type] menu are identical. On the
Graph window, you can uses the [Type] menu or the applicable icon on the toolbar to change the graph type after a
graph is drawn.
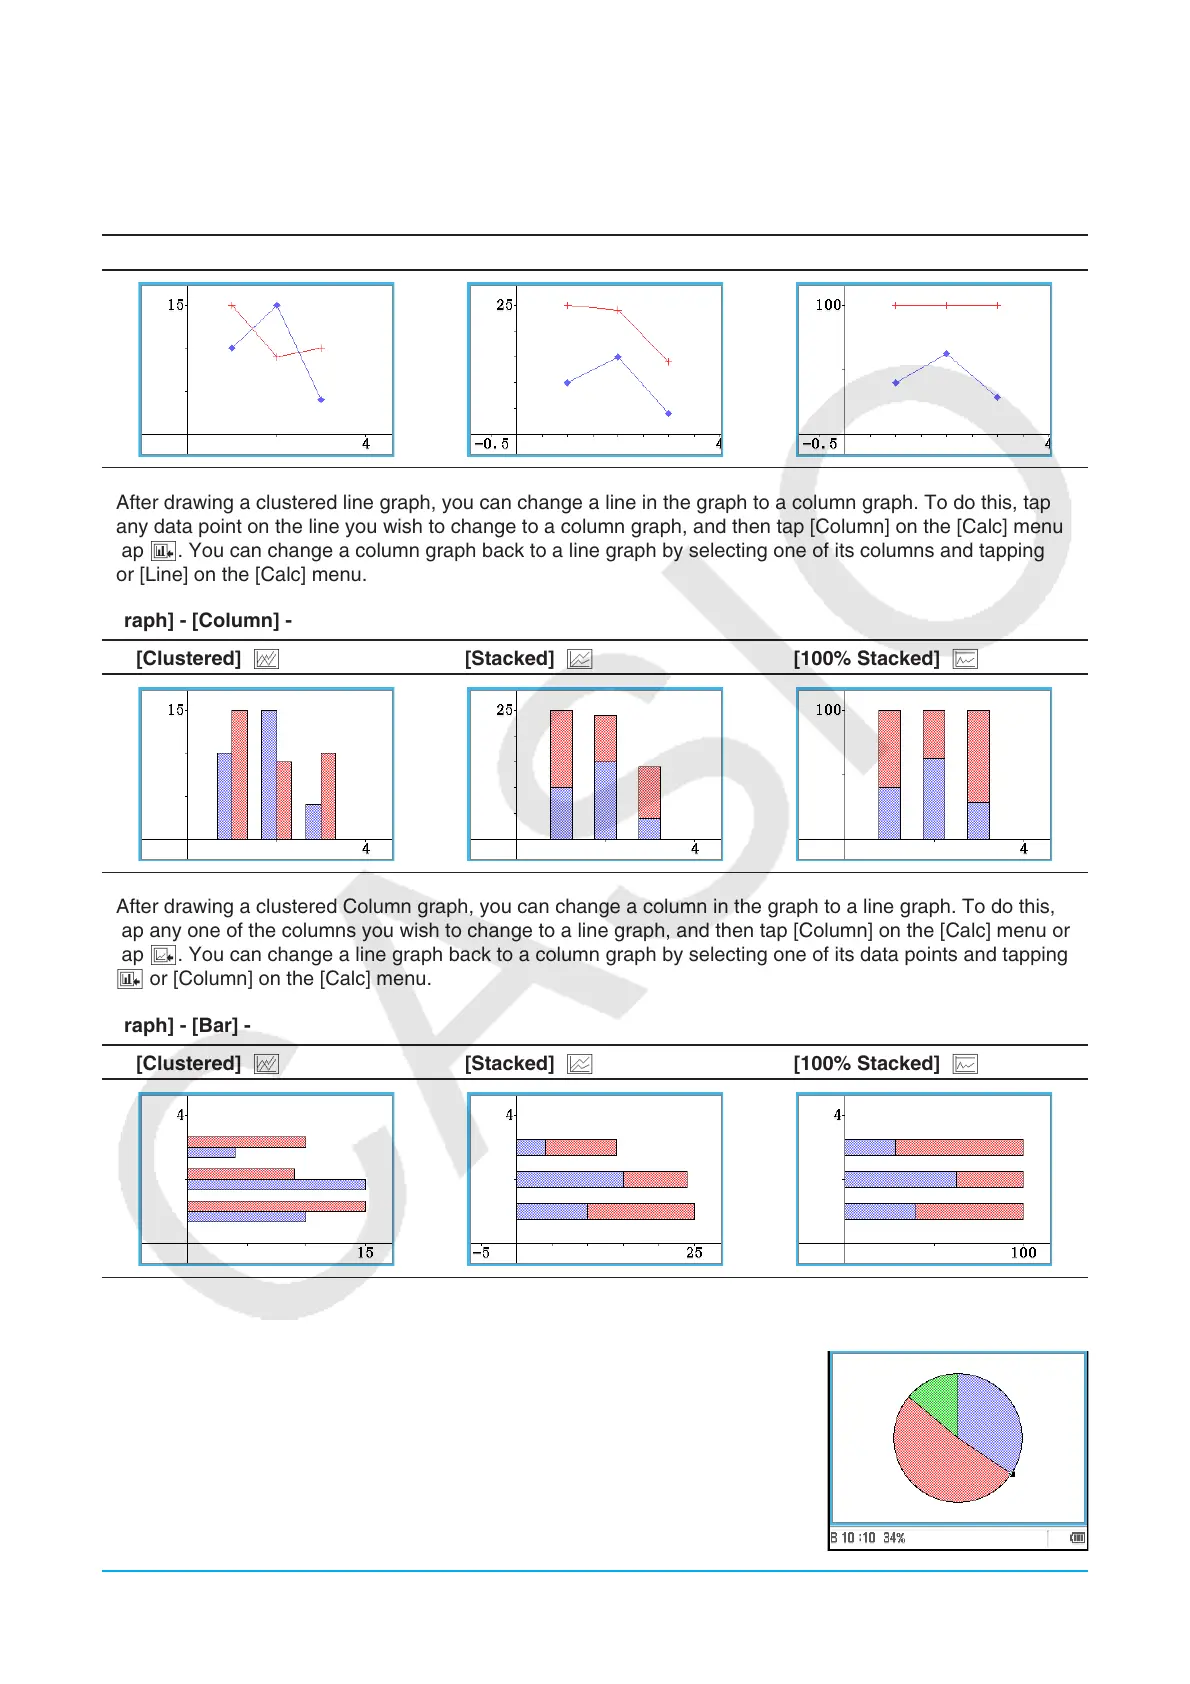
[Graph] - [Line] -
[Clustered] D [Stacked] F [100% Stacked] G
• After drawing a clustered line graph, you can change a line in the graph to a column graph. To do this, tap
any data point on the line you wish to change to a column graph, and then tap [Column] on the [Calc] menu or
tap '. You can change a column graph back to a line graph by selecting one of its columns and tapping z
or [Line] on the [Calc] menu.
[Graph] - [Column] -
[Clustered] D [Stacked] F [100% Stacked] G
• After drawing a clustered Column graph, you can change a column in the graph to a line graph. To do this,
tap any one of the columns you wish to change to a line graph, and then tap [Column] on the [Calc] menu or
tap z. You can change a line graph back to a column graph by selecting one of its data points and tapping
' or [Column] on the [Calc] menu.
[Graph] - [Bar] -
[Clustered] D [Stacked] F [100% Stacked] G
[Graph] - [Pie] Z
• When you select a pie chart, only the first series (column or row) of the
selected data is used.
• Tapping any of the sections of a pie graph causes three values to appear at
the bottom of the screen: the cell location, a data value for the section, and
a percent value that indicates the portion of the total data that the data value
represents.

 Loading...


