Chapter 13: Spreadsheet Application 241
[Graph] - [Scatter] X
• When plotting a scatter graph of multiple different data series, the first series
(column or row) of selected values is used as the
x-values for all plots. The
other selected values are used as the
y-value for each of the plots. This
means if you select three columns of data (like Columns A, B, and C), for
example, there will be two different plot point types: (A, B) and (A, C).
• When plotting a scatter graph of a single data series (selecting [Graph] -
[Column Series] to graph a single column of data or [Graph] - [Row Series]
to graph a single row of data),
x-axis data numbers (1, 2, 3...) are fixed and
each data item is plotted on the y-axis.
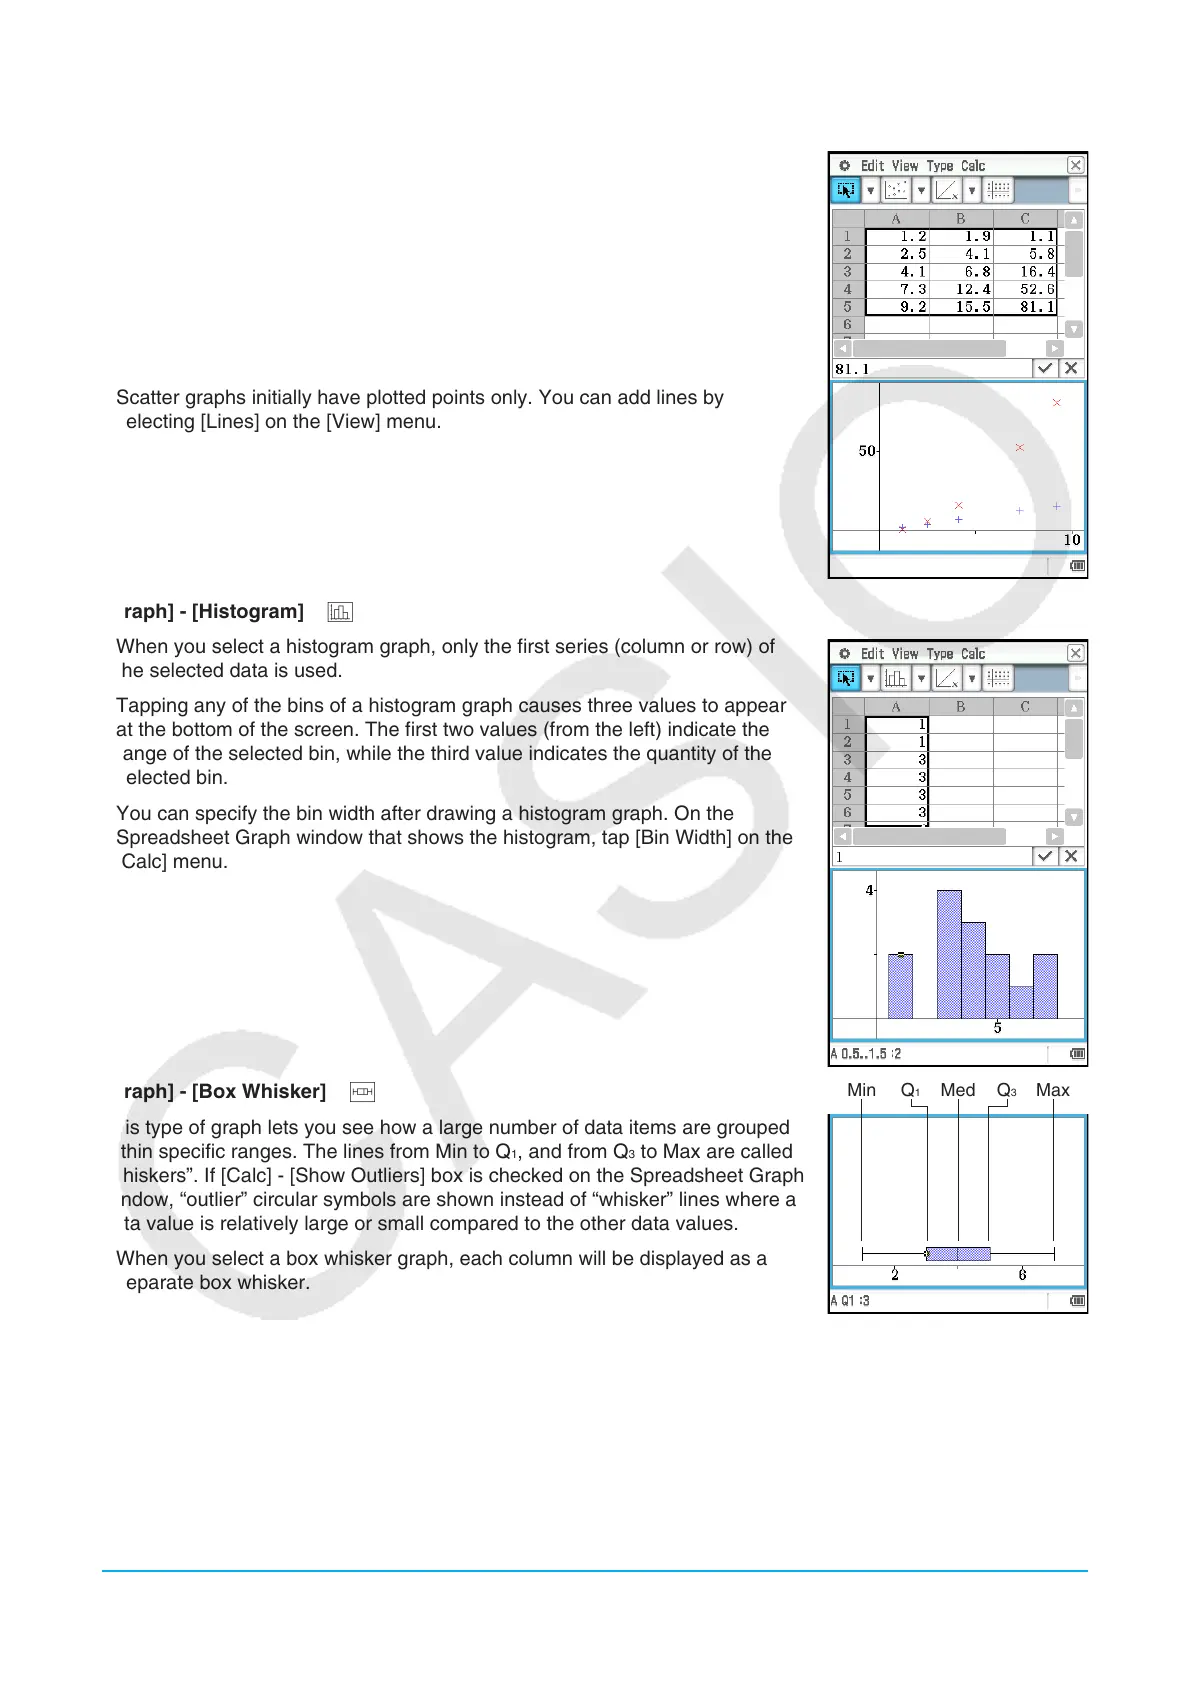
• Scatter graphs initially have plotted points only. You can add lines by
selecting [Lines] on the [View] menu.
[Graph] - [Histogram] 3
• When you select a histogram graph, only the first series (column or row) of
the selected data is used.
• Tapping any of the bins of a histogram graph causes three values to appear
at the bottom of the screen. The first two values (from the left) indicate the
range of the selected bin, while the third value indicates the quantity of the
selected bin.
• You can specify the bin width after drawing a histogram graph. On the
Spreadsheet Graph window that shows the histogram, tap [Bin Width] on the
[Calc] menu.
[Graph] - [Box Whisker] 1
This type of graph lets you see how a large number of data items are grouped
within specific ranges. The lines from Min to Q
1
, and from Q
3
to Max are called
“whiskers”. If [Calc] - [Show Outliers] box is checked on the Spreadsheet Graph
window, “outlier” circular symbols are shown instead of “whisker” lines where a
data value is relatively large or small compared to the other data values.
• When you select a box whisker graph, each column will be displayed as a
separate box whisker.
• Tapping the Q
1
, Q
3
, Med, Min, or Max location of a box whisker graph will
cause the applicable value to appear at the bottom of the screen.
Q
3
MedMin MaxQ
1

 Loading...


