Appendix 300
Name Description Op Type
GconHStep
{1}
Graph transformation vertical
step value
N/N Ex_r
GconWEnd
{5}
Graph transformation horizontal
end point
N/N Ex_r
GconWStart
{1}
Graph transformation horizontal
start point
N/N Ex_r
GconWStep
{1}
Graph transformation horizontal
step value
N/N Ex_r
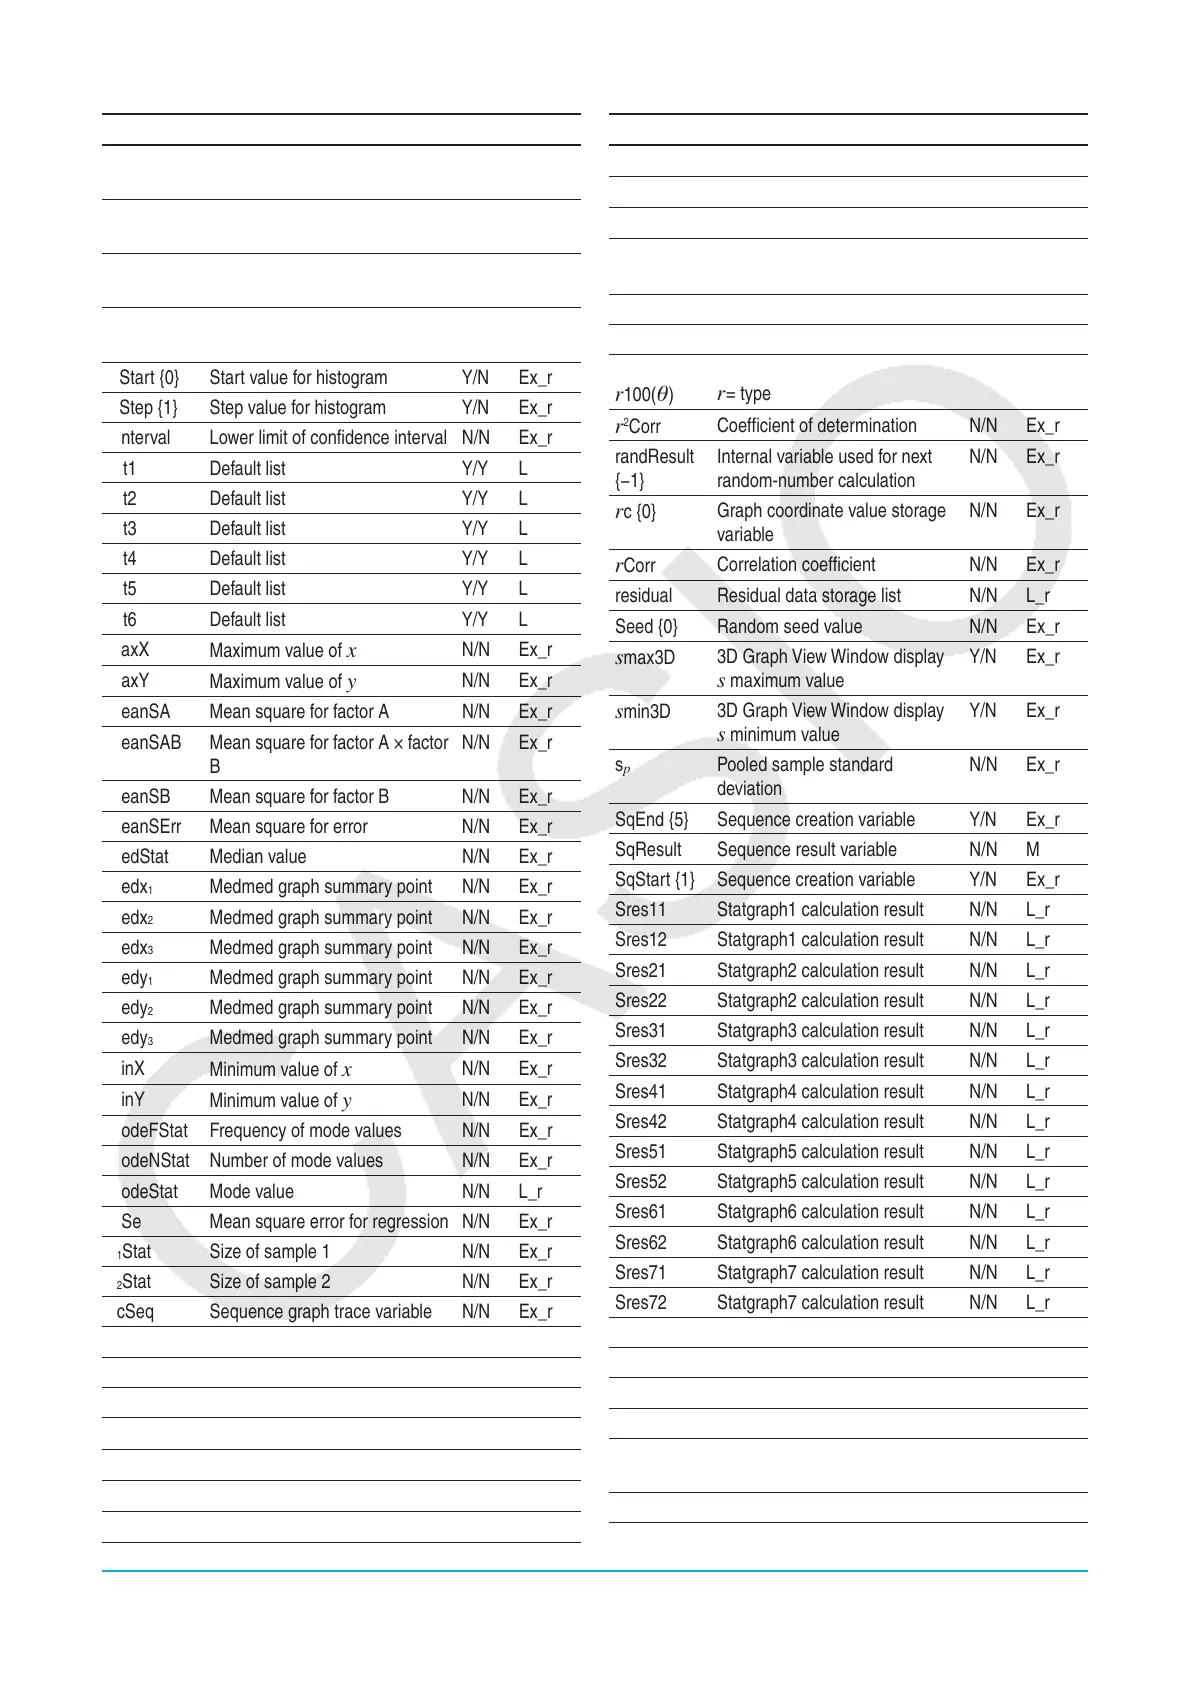
HStart {0} Start value for histogram Y/N Ex_r
HStep {1} Step value for histogram Y/N Ex_r
LInterval Lower limit of confidence interval N/N Ex_r
list1 Default list Y/Y L
list2 Default list Y/Y L
list3 Default list Y/Y L
list4 Default list Y/Y L
list5 Default list Y/Y L
list6 Default list Y/Y L
maxX
Maximum value of
x
N/N Ex_r
maxY
Maximum value of
y
N/N Ex_r
MeanSA Mean square for factor A N/N Ex_r
MeanSAB Mean square for factor A × factor
B
N/N Ex_r
MeanSB Mean square for factor B N/N Ex_r
MeanSErr Mean square for error N/N Ex_r
MedStat Median value N/N Ex_r
medx
1
Medmed graph summary point N/N Ex_r
medx
2
Medmed graph summary point N/N Ex_r
medx
3
Medmed graph summary point N/N Ex_r
medy
1
Medmed graph summary point N/N Ex_r
medy
2
Medmed graph summary point N/N Ex_r
medy
3
Medmed graph summary point N/N Ex_r
minX
Minimum value of
x
N/N Ex_r
minY
Minimum value of
y
N/N Ex_r
ModeFStat Frequency of mode values N/N Ex_r
ModeNStat Number of mode values N/N Ex_r
ModeStat Mode value N/N L_r
MSe Mean square error for regression N/N Ex_r
n
1
Stat Size of sample 1 N/N Ex_r
n
2
Stat Size of sample 2 N/N Ex_r
ncSeq Sequence graph trace variable N/N Ex_r
nSeq Sequence variable N/N Ex_r
nStat Sample size N/N Ex_r
Observed
Observed matrix for χ
2
test
N/N M _r
ˆp
Estimated proportion N/N Ex_r
ˆp
1
Estimated proportion of sample 1 N/N Ex_r
ˆp
2
Estimated proportion of sample 2 N/N Ex_r
prob p-value
N/N Ex_r
Name Description Op Type
probA p-value of factor A
N/N Ex_r
probAB p-value of factor A × factor B
N/N Ex_r
probB p-value of factor B
N/N Ex_r
py1(x) -
py5(x)
Picture Plot function expression Y/Y F
Q
1
Stat First quartile point N/N Ex_r
Q
3
Stat Third quartile point N/N Ex_r
r1() -
r100()
Graph expression input variable,
r= type
Y/Y F
r
2
Corr
Coefficient of determination N/N Ex_r
randResult
{−1}
Internal variable used for next
random-number calculation
N/N Ex_r
rc {0}
Graph coordinate value storage
variable
N/N Ex_r
rCorr
Correlation coefficient N/N Ex_r
residual Residual data storage list N/N L_r
Seed {0} Random seed value N/N Ex_r
smax3D
3D Graph View Window display
s maximum value
Y/N Ex_r
smin3D
3D Graph View Window display
s minimum value
Y/N Ex_r
s
p
Pooled sample standard
deviation
N/N Ex_r
SqEnd {5} Sequence creation variable Y/N Ex_r
SqResult Sequence result variable N/N M
SqStart {1} Sequence creation variable Y/N Ex_r
Sres11 Statgraph1 calculation result N/N L_r
Sres12 Statgraph1 calculation result N/N L_r
Sres21 Statgraph2 calculation result N/N L_r
Sres22 Statgraph2 calculation result N/N L_r
Sres31 Statgraph3 calculation result N/N L_r
Sres32 Statgraph3 calculation result N/N L_r
Sres41 Statgraph4 calculation result N/N L_r
Sres42 Statgraph4 calculation result N/N L_r
Sres51 Statgraph5 calculation result N/N L_r
Sres52 Statgraph5 calculation result N/N L_r
Sres61 Statgraph6 calculation result N/N L_r
Sres62 Statgraph6 calculation result N/N L_r
Sres71 Statgraph7 calculation result N/N L_r
Sres72 Statgraph7 calculation result N/N L_r
Sres81 Statgraph8 calculation result N/N L_r
Sres82 Statgraph8 calculation result N/N L_r
Sres91 Statgraph9 calculation result N/N L_r
Sres92 Statgraph9 calculation result N/N L_r
sStat Standard error value for Linear
Reg
t-Test calculation
N/N Ex_r
SumSA Sum of squares for factor A N/N Ex_r

 Loading...


