Appendix 301
Name Description Op Type
SumSAB Sum of squares for factor A ×
factor B
N/N Ex_r
SumSB Sum of squares for factor B N/N Ex_r
SumSErr Sum of squares for error N/N Ex_r
s
x
Sample standard deviation of x
N/N Ex_r
sx
1
Sample standard deviation of
data 1
N/N Ex_r
s
x
2
Sample standard deviation of
data 2
N/N Ex_r
sy
Sample standard deviation of y
N/N Ex_r
tc {0}
Graph coordinate value storage
variable
N/N Ex_r
tLower
Result of TCD calculation N/N Ex_r
tmax3D 3D Graph View Window display t
maximum value
Y/N Ex_r
tmin3D 3D Graph View Window display t
minimum value
Y/N Ex_r
tUpper
Result of TCD calculation N/N Ex_r
Tvalue
t value
N/N Ex_r
tmax {2π} View Window t Max value
Y/N Ex_r
tmin {0} View Window t Min value
Y/N Ex_r
tStep
{π / 60}
View Window t Step value
Variable
Y/N Ex_r
UInterval Upper limit of confidence interval N/N Ex_r
o
Mean of x
N/N Ex_r
o
1
Mean of data 1 N/N Ex_r
x1(y) -
x100(y)
Graph expression input variable,
x= type
Y/Y F
x
1
InvN
Result of InvNorm calculation N/N Ex_r
o
2
Mean of data 2 N/N Ex_r
x
2
InvN
Result of InvNorm calculation N/N Ex_r
xc {0}
Graph coordinate value storage
variable
N/N Ex_r
xdot {0.1} View Window 1-dot x-axis value
Y/N Ex_r
xfact {2} Factor zoom x-factor value
Y/N Ex_r
xgrid3D
3D Graph View Window value Y/N Ex_r
xInv
Result of inverse cumulative
distribution calculations
N/N Ex_r
xmax {7.7}
View Window display range
x-axis maximum value
Y/N Ex_r
xmax3D
3D Graph View Window display
range
x-axis maximum value
Y/N Ex_r
xmin {−7.7}
View Window display range
x-axis minimum value
Y/N Ex_r
xmin3D
3D Graph View Window display
range
x-axis minimum value
Y/N Ex_r
xscl {1}
View Window display range
xscale
Y/N Ex_r
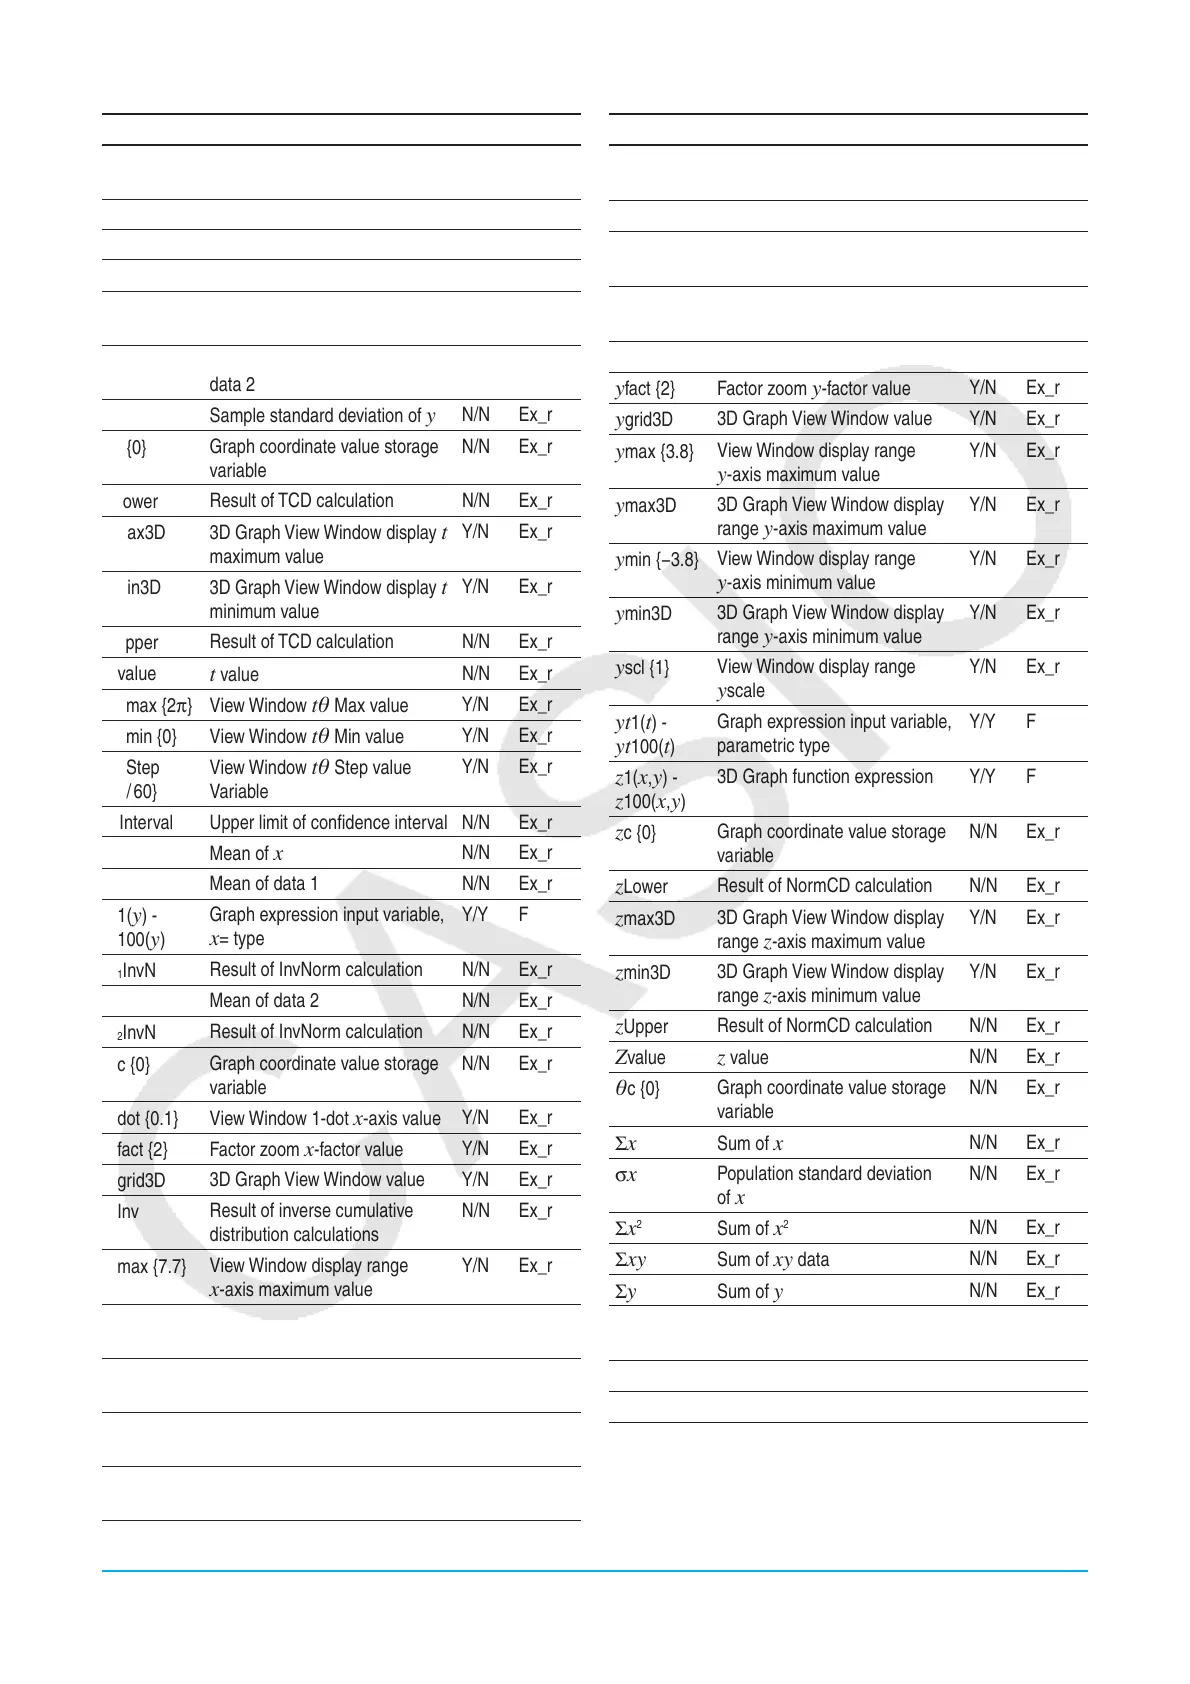
Name Description Op Type
xt1(t) -
xt100(t)
Graph expression input variable,
parametric type
Y/Y F
p
Mean of
y
N/N Ex_r
y1(x) -
y100(x)
Graph expression input variable,
y= type
Y/Y F
yc {0}
Graph coordinate value storage
variable
N/N Ex_r
ydot {0.1} View Window 1-dot y-axis value
Y/N Ex_r
yfact {2} Factor zoom y-factor value
Y/N Ex_r
ygrid3D
3D Graph View Window value Y/N Ex_r
ymax {3.8}
View Window display range
y-axis maximum value
Y/N Ex_r
ymax3D
3D Graph View Window display
range
y-axis maximum value
Y/N Ex_r
ymin {−3.8}
View Window display range
y-axis minimum value
Y/N Ex_r
ymin3D
3D Graph View Window display
range
y-axis minimum value
Y/N Ex_r
yscl {1}
View Window display range
yscale
Y/N Ex_r
yt1(t) -
yt100(t)
Graph expression input variable,
parametric type
Y/Y F
z1(x,y) -
z100(x,y)
3D Graph function expression Y/Y F
zc {0}
Graph coordinate value storage
variable
N/N Ex_r
zLower
Result of NormCD calculation N/N Ex_r
zmax3D
3D Graph View Window display
range
z-axis maximum value
Y/N Ex_r
zmin3D
3D Graph View Window display
range
z-axis minimum value
Y/N Ex_r
zUpper
Result of NormCD calculation N/N Ex_r
Zvalue z value
N/N Ex_r
c {0}
Graph coordinate value storage
variable
N/N Ex_r
Σ
x Sum of x
N/N Ex_r
σ
x
Population standard deviation
of x
N/N Ex_r
Σ
x
2
Sum of x
2
N/N Ex_r
Σ
xy Sum of xy data
N/N Ex_r
Σ
y Sum of y
N/N Ex_r
σ
y
Population standard deviation
of y
N/N Ex_r
Σ
y
2
Sum of y
2
N/N Ex_r
χ
2
value χ
2
value
N/N Ex_r