– 29 –
Graph Settings
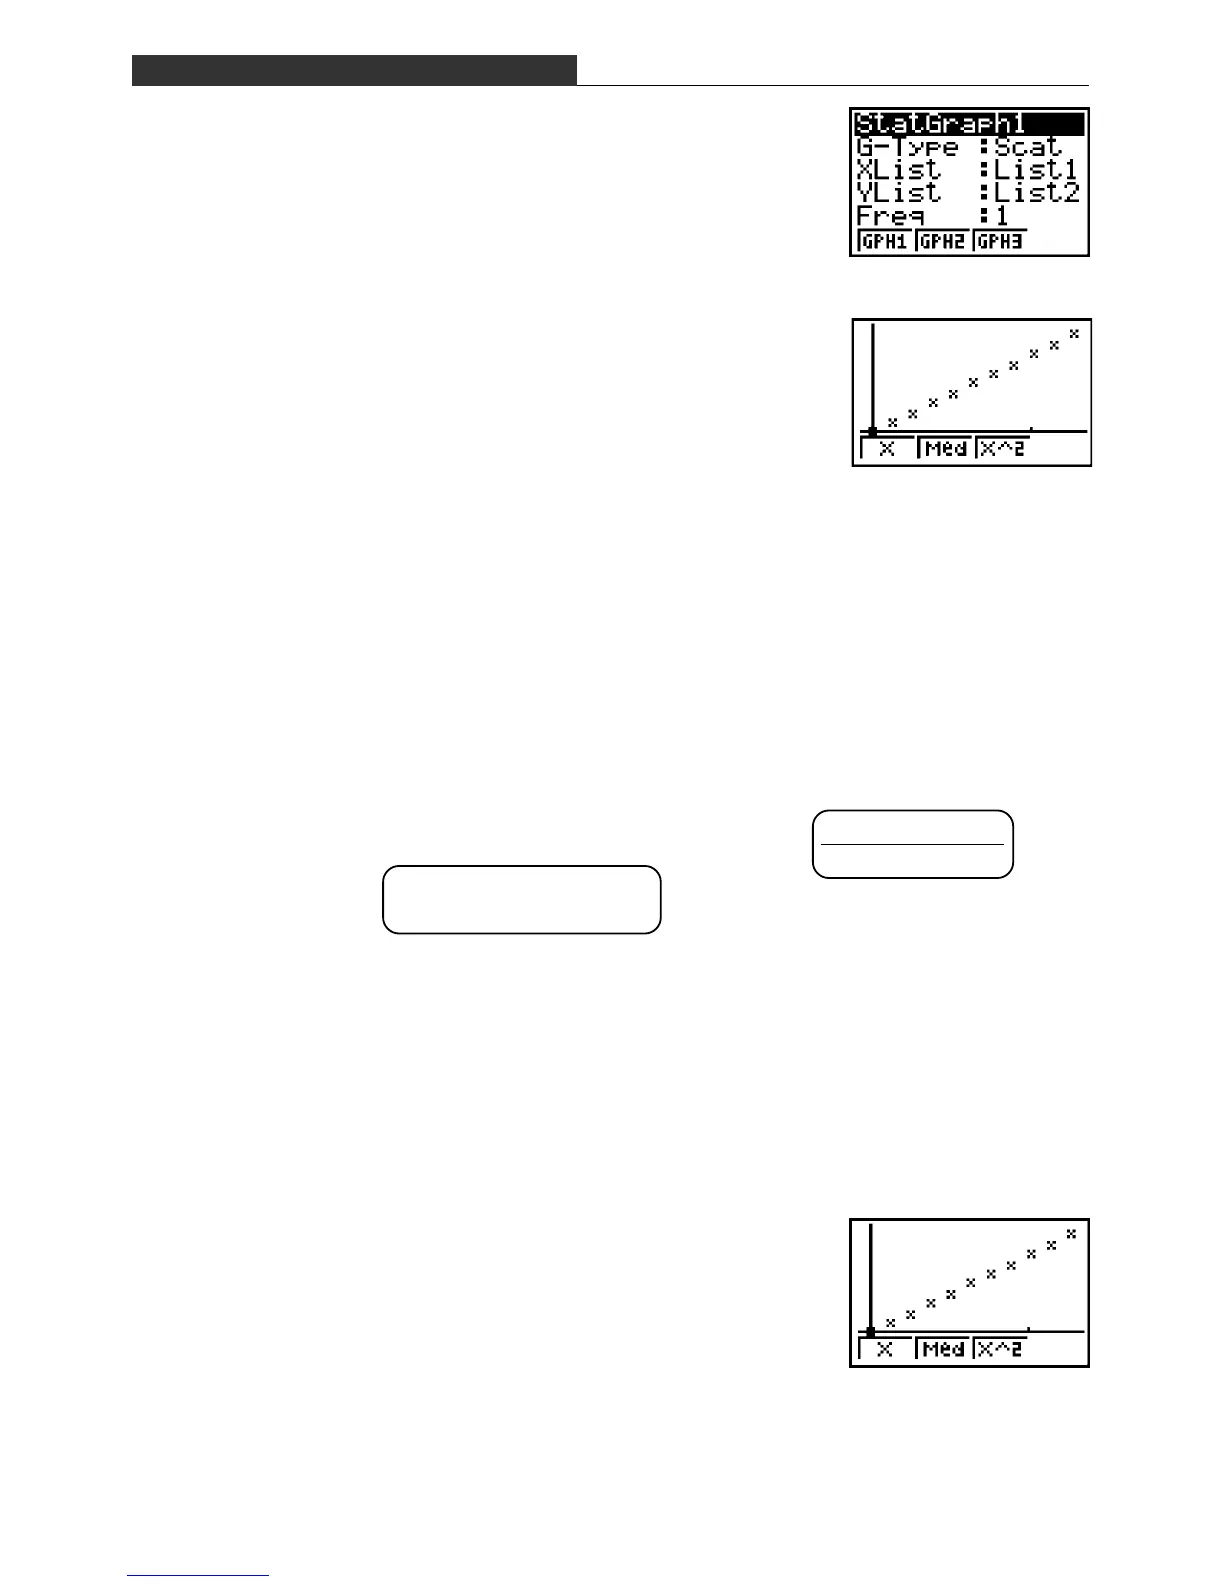
Press 1(GRPH) [ 4(SET) to check the graph set-
tings. Use f and c to move the cursor around the
display and use keys 1 through[ to change the set-
tings to they are like the ones shown on the screen nearby.
Graphing
Press Q1(GRPH) 1(GPH1) to display the graph
(scatter diagram).
Data Editing
• To change data, move the cursor to the data you want to change and over write it with the
correct data.
• To insert data, move the cursor to the location of the insert, and then press [3(INS).
• To delete data, move the cursor to the data you want to delete, and then press
• To return from the graph screen to the data input screen, press Q .
6. Analyzing data
The small signal current amplification ratio h fe of the transistor is .
This is represented as on the graph.
You can calculate the slope of the line on the graphic calculator automatically.
Calculation of the slope and other information from the obtained data is performed using
linear regression. Though the actual calculation is quite complex and difficult to perform, the
graphic calculator performs linear regression in an instant and provides the slope and y-
intercept.
Graphing
Press Q1(GRPH)1(GPH1) to display the graph
(scatter diagram).
EE-3 Small Signal Amplification Factor of a Transistor
[1(DEL).

 Loading...


