– 30 –
Linear Regression
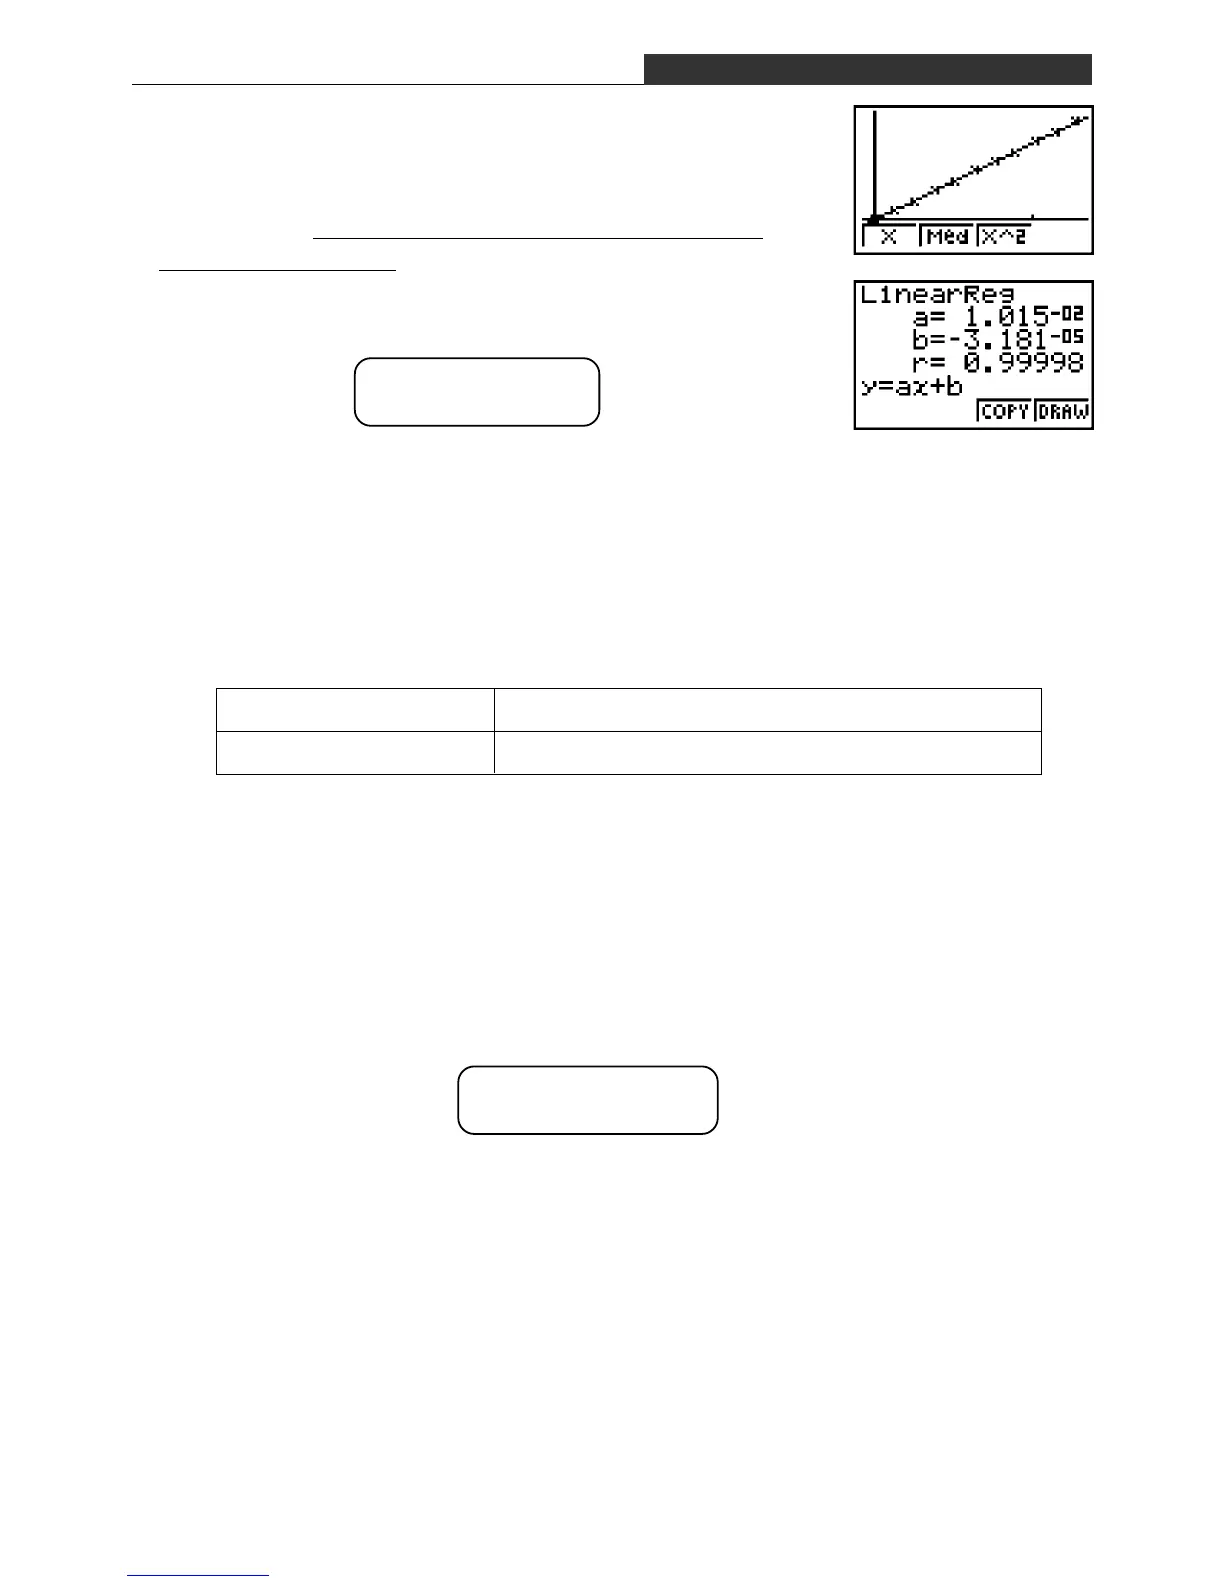
Pressing 1 (X) 4 (DRAW) performs linear regression
and overlays it onto the scatter diagram as shown on the
screen nearby. Pressing 1 displays the slope, which is the
value indicated for “a=”.
This result indicates that the following is the small signal
current amplification ratio of transistor 2SC1815.
h fe =
Use the same procedure to determine the small signal current amplification
ratio h
fe of transistor 2SD1763.
(1) Measure values.
• Input measurement results into the table below.
(2) Graph the results.
• Without deleting the previous data, input the base current into List 3 and the collector-
emitter current into List 4.
• Draw the graph. Select List 3 for the X-axis and List 4 for the Y-axis.
(3) Determine the small signal current amplification ratio h fe.
• Use the graphic calculator’s linear regression function to calculate h fe.
h fe =
Collector-emitter Current (mA)
Base Current (µA)
EE-3 Small Signal Amplification Factor of a Transistor

 Loading...


