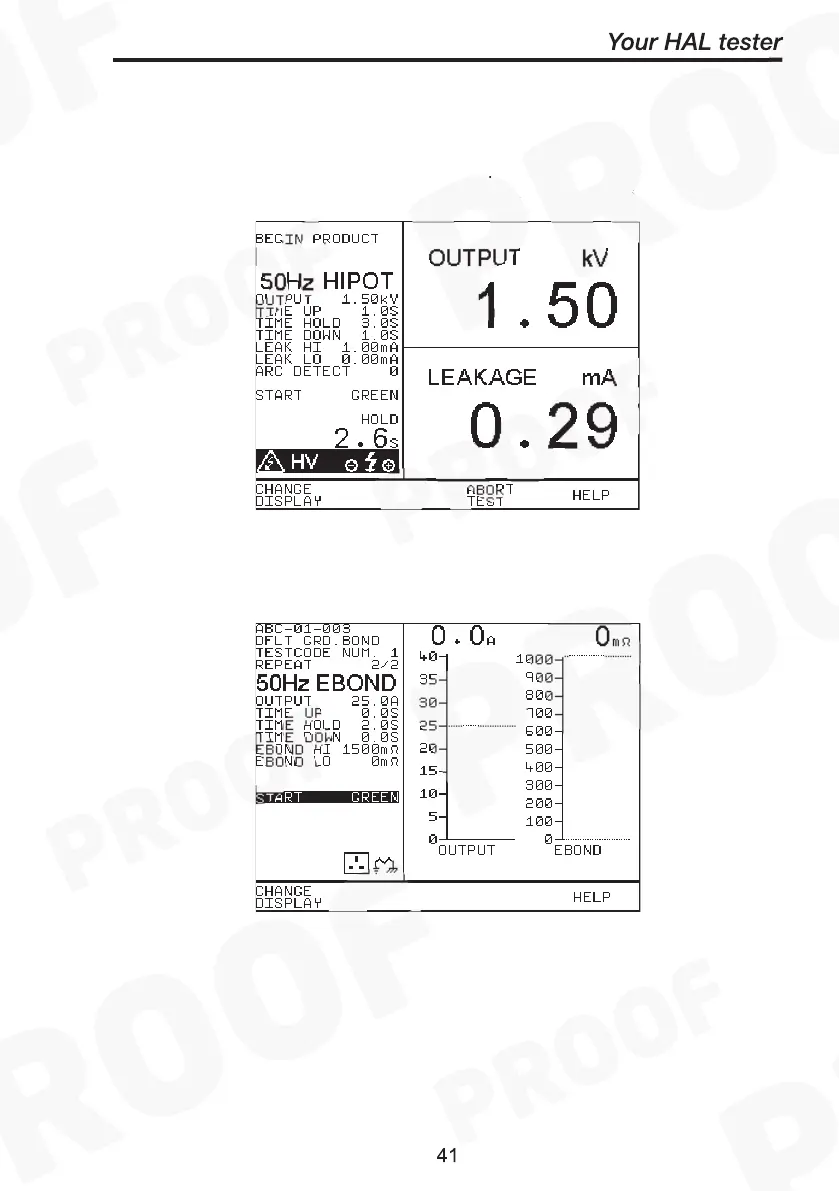
The bar graphs are clearly marked, and include dashed lines to indicate
the limit points. At the top of each bar graph there is a numerical
display of the actual value.
Press
Change Display
- allows the right panel to be changed to display
the readings via large high visibility DVM style displays, see below:
E.g. of G
Meter Screen:-