CONSUMPTION
25
CONTENTS
CONSUMPTION
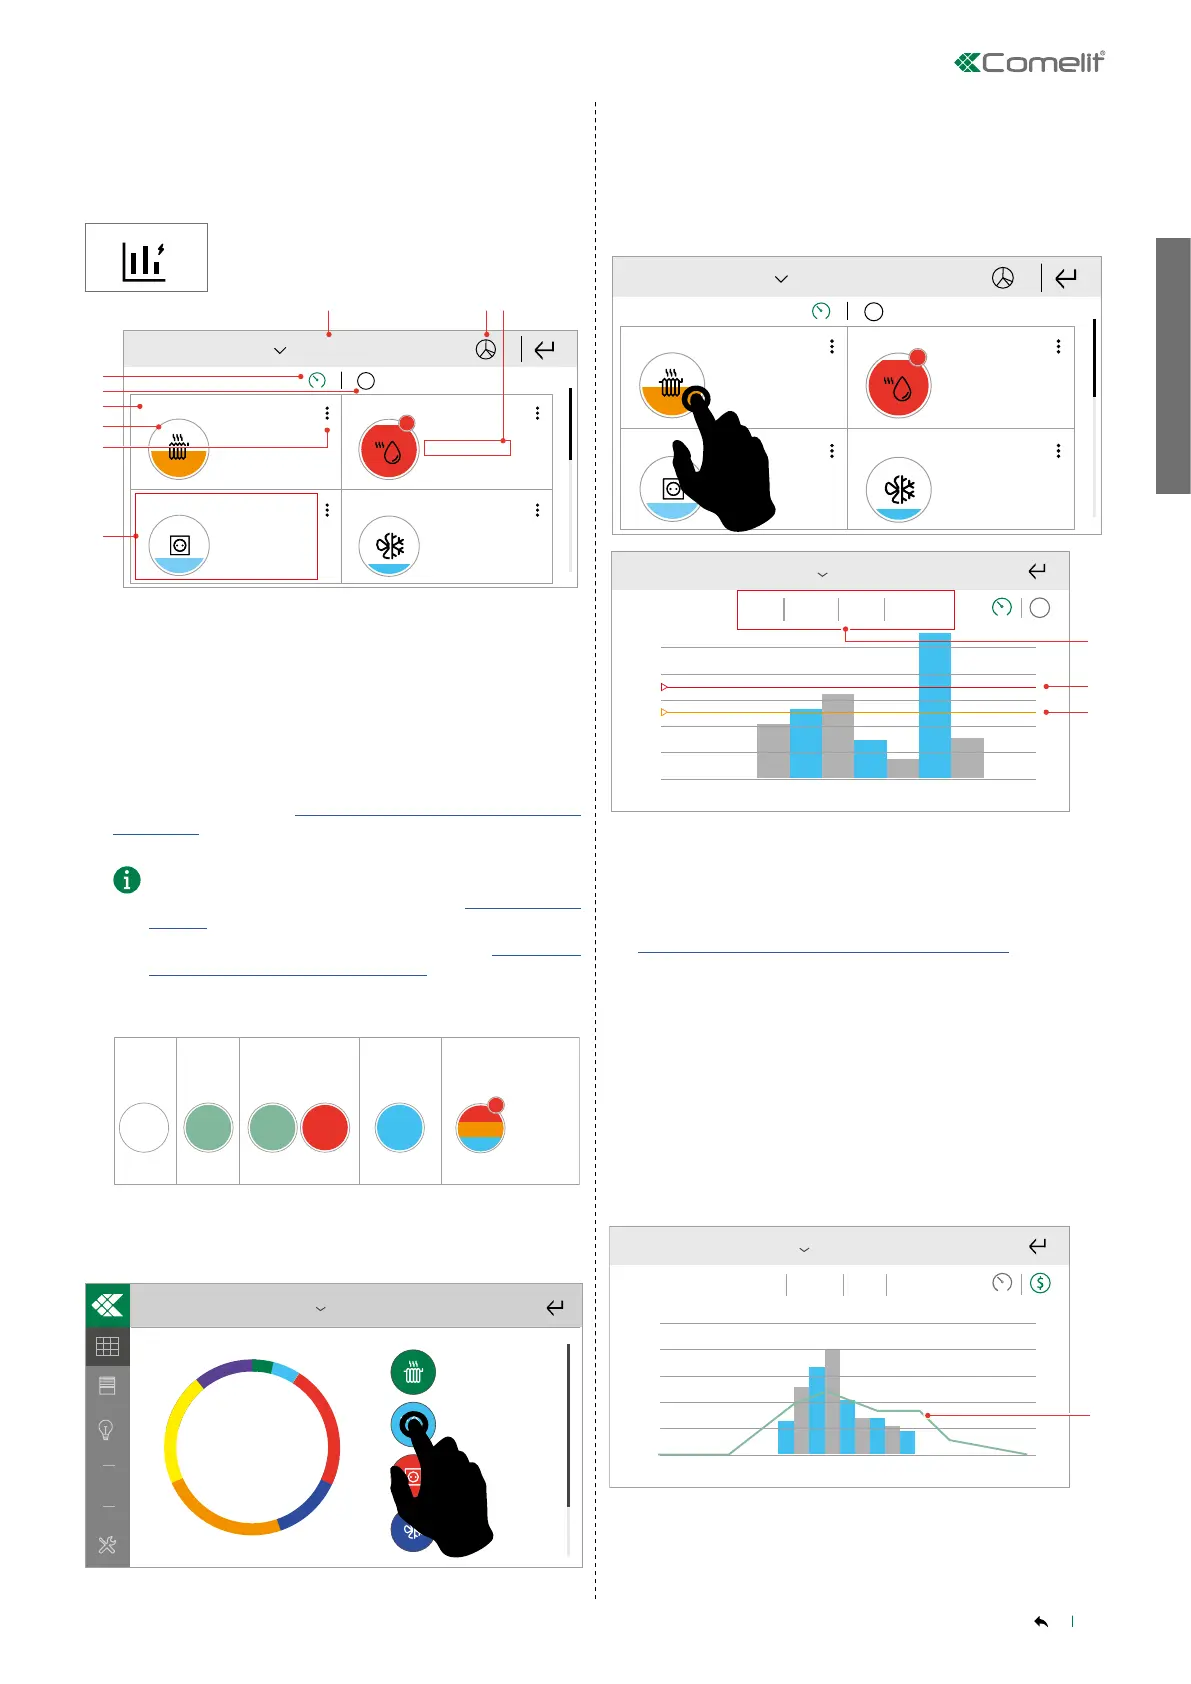
This menu can be used to monitor consumption for the managed
modules by means of icons and graphs.
Press the icon to access the menu.
2020-03-02
$
Riscaldamento
Consumo mensile
Riscaldamento
Consumo mensile
Consumo istantaneo
Consumo istantaneo
Consumo istantaneo
Riscaldamento
Consumo mensile
2.
3.
4.
5.
6.
7.
53 kWh / 200 KWh
0,2 kW
34 kWh / 200 KWh
0,2 kW
Consumo istantaneo
Riscaldamento
Consumo mensile
262 kWh / 230 KWh
0,2 kW
!
Element 1
Monthly consumption
Monthly consumption Monthly consumption
Monthly consumption
Instant consumption
Instant consumption Instant consumption
Instant consumption
Element 3
Element 2
Element 4
1. Select the period for which you want to show data
2. Show energy consumption
3. Show consumption in monetary terms
4. Name assigned to the module
5. Icon assigned to the module
6. Element settings menu
7. Consumption values for the selected period
8. Comparison between actual consumption and set consumption
(Threshold) for the selected period.
√ The Threshold value is only visible if a maximum consumption
threshold has been set in “Setup-User setup menu-Consumption-
Thresholds"
• You can set consumption thresholds in the edit menu [6.]
or via the User setup menu (see paragraph “Thresholds" on
page 36).
• You can only set the "Hour" threshold in the “Setup-User
setup menu-Consumption-Thresholds" menu.
KEY TO COLOURS
!
< 75%
> 100%
>75% <100%
>Production >Consumption
CO₂ Production
Comparison
Max. threshold
value
NOT SET
Max. threshold value
SET
9. Summary of the overall monetary consumption situation for the
managed elements.
2019-05-02
Riscaldamento
Totale Mese
62,48 €
Month total
Heating
Select the relevant module from the list to view the corresponding
graph.
Show power consumption graph
2020-03-02
$
Riscaldamento
Consumo mensile
Riscaldamento
Consumo mensile
Consumo istantaneo
Consumo istantaneo
Consumo istantaneo
Riscaldamento
Consumo mensile
53 kWh / 200 KWh
0,2 kW
34 kWh / 200 KWh
0,2 kW
Consumo istantaneo
Riscaldamento
Consumo mensile
262 kWh / 230 KWh
0,2 kW
!
Element 1
Element 3
Element 2
Element 4
Monthly consumption Monthly consumption
Monthly consumption Monthly consumption
Instant consumption Instant consumption
Instant consumption Instant consumption
0.00
98.7k
197k
296k
493k
394k
758kWh
21 3 4 5 6 7 8 9 10 11 12
Total Day Month Year Historical
$
2019Name
1. Select the period for which to show consumption data. You can
view consumption by day, month, calendar year or the last 5 years.
2. Maximum set consumption threshold.
√ Only visible if a maximum consumption threshold has been set in
“Setup-User setup menu-Consumption-Thresholds"
3. Consumption at 75% of the maximum set threshold.
______________________________________________________________
CONSUMPTION/PRODUCTION
COMPARISON
If there are load and consumption management modules configured
as production in the system, the system can provide a comparison
between production and consumption.
0.00
758€
40 8 12 16 20 24
2019-05-02
Total Day Month Year Historical
Name
The production value is represented by a green line over the
consumption figures.