22 | CORNING VIDEODROP
7.2.6 Results/Analysis
All the following metric values are updated at the end of each video processing
until the measurement stops.
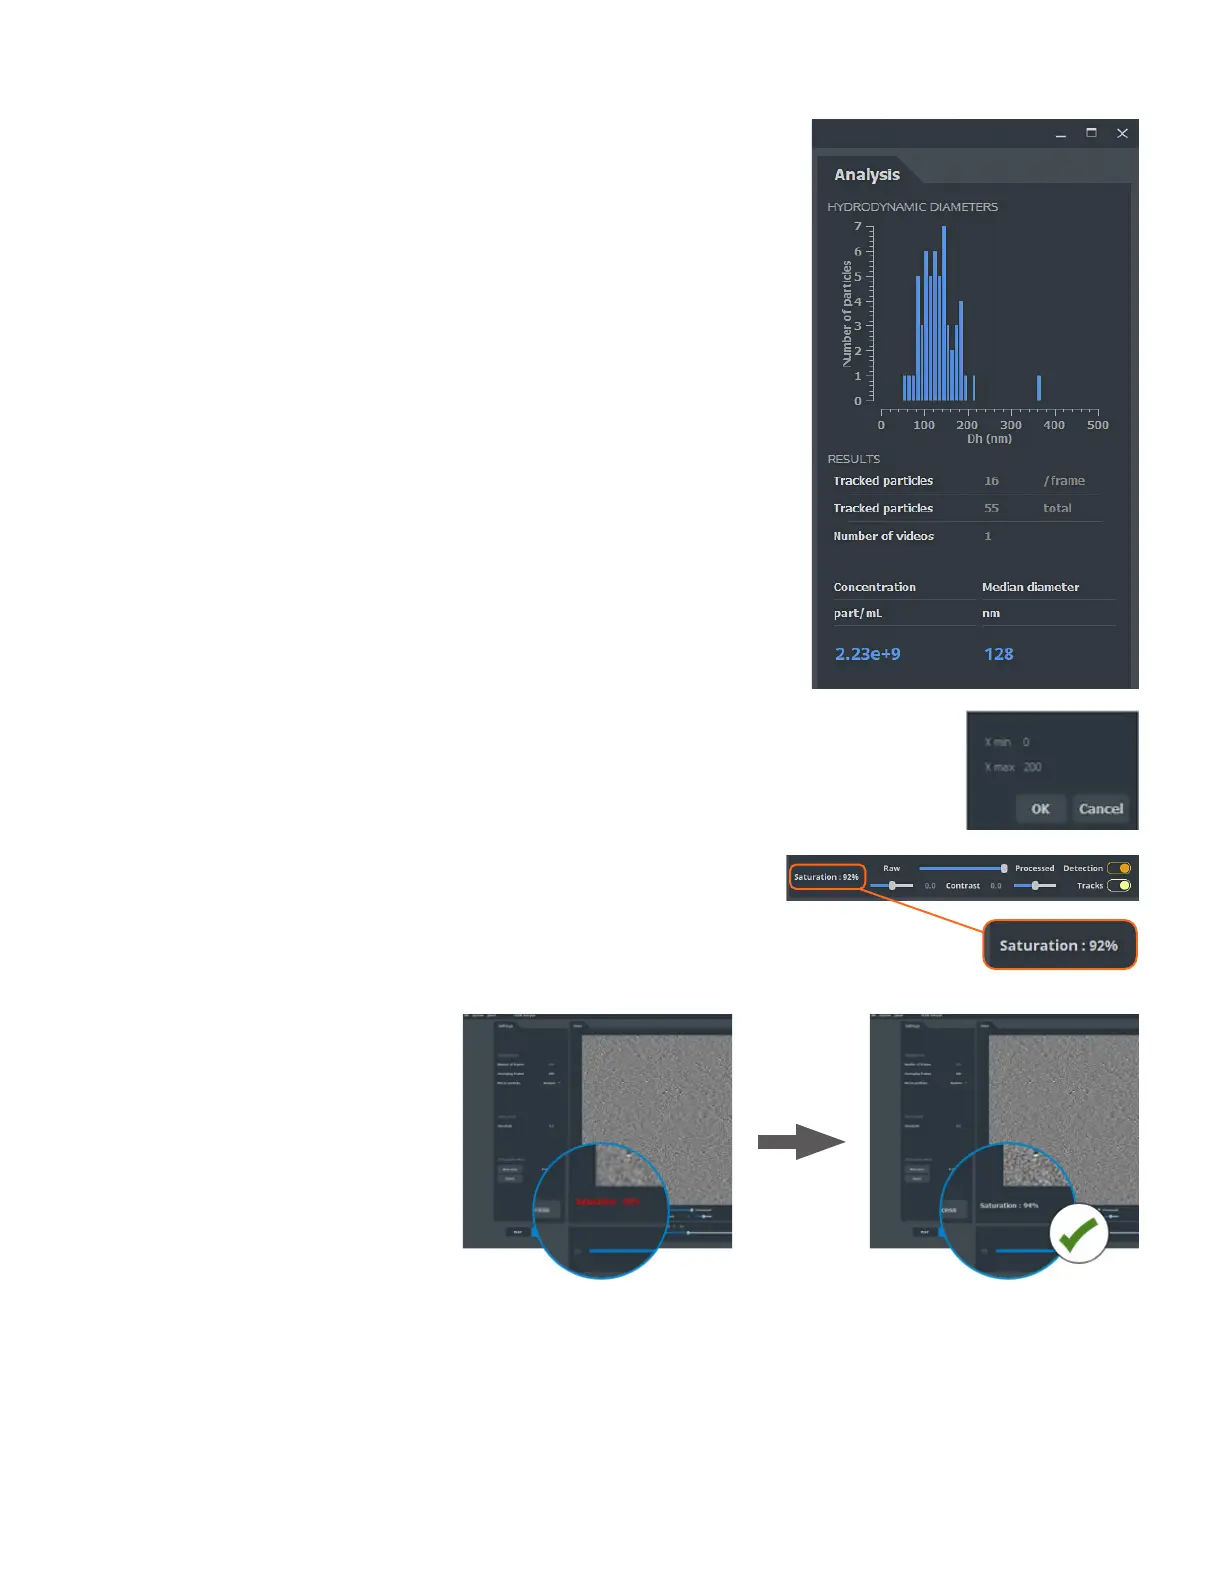
HYDRODYNAMIC DIAMETERS HISTOGRAM
Histogram built with all the tracked particles in the videos recorded in a
measurement.
RESULTS
Tracked particles (per frame)
Number of particles tracked in the displayed image.
Tracked particles (total)
Total number of particles tracked in the measurement. This number is
accumulated video after video during a measurement.
Number of videos
Number of videos recorded in the current measurement.
Concentration
Concentration in particle per mL measured in the sample.
Median diameter
Median hydrodynamic diameter (nm) of the above histogram.
DISPLAY OPTION OF THE HISTOGRAM
Histogram scale
Histogram axis scales can be modified by double-clicking on the axes.
A window appears where the user can set the minimum size (x min) and the
maximum size (x max).
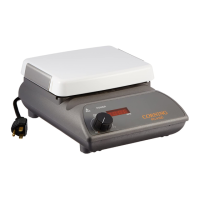
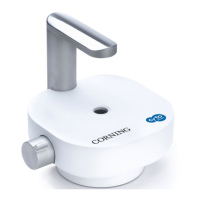
7.2.7 Adjust saturation
Camera saturation is displayed in the main window. Its value must be between
90% and 95%.
The LED intensity is automatically
adjusted between each video to
ensure optimal camera saturation.