SCADA
136
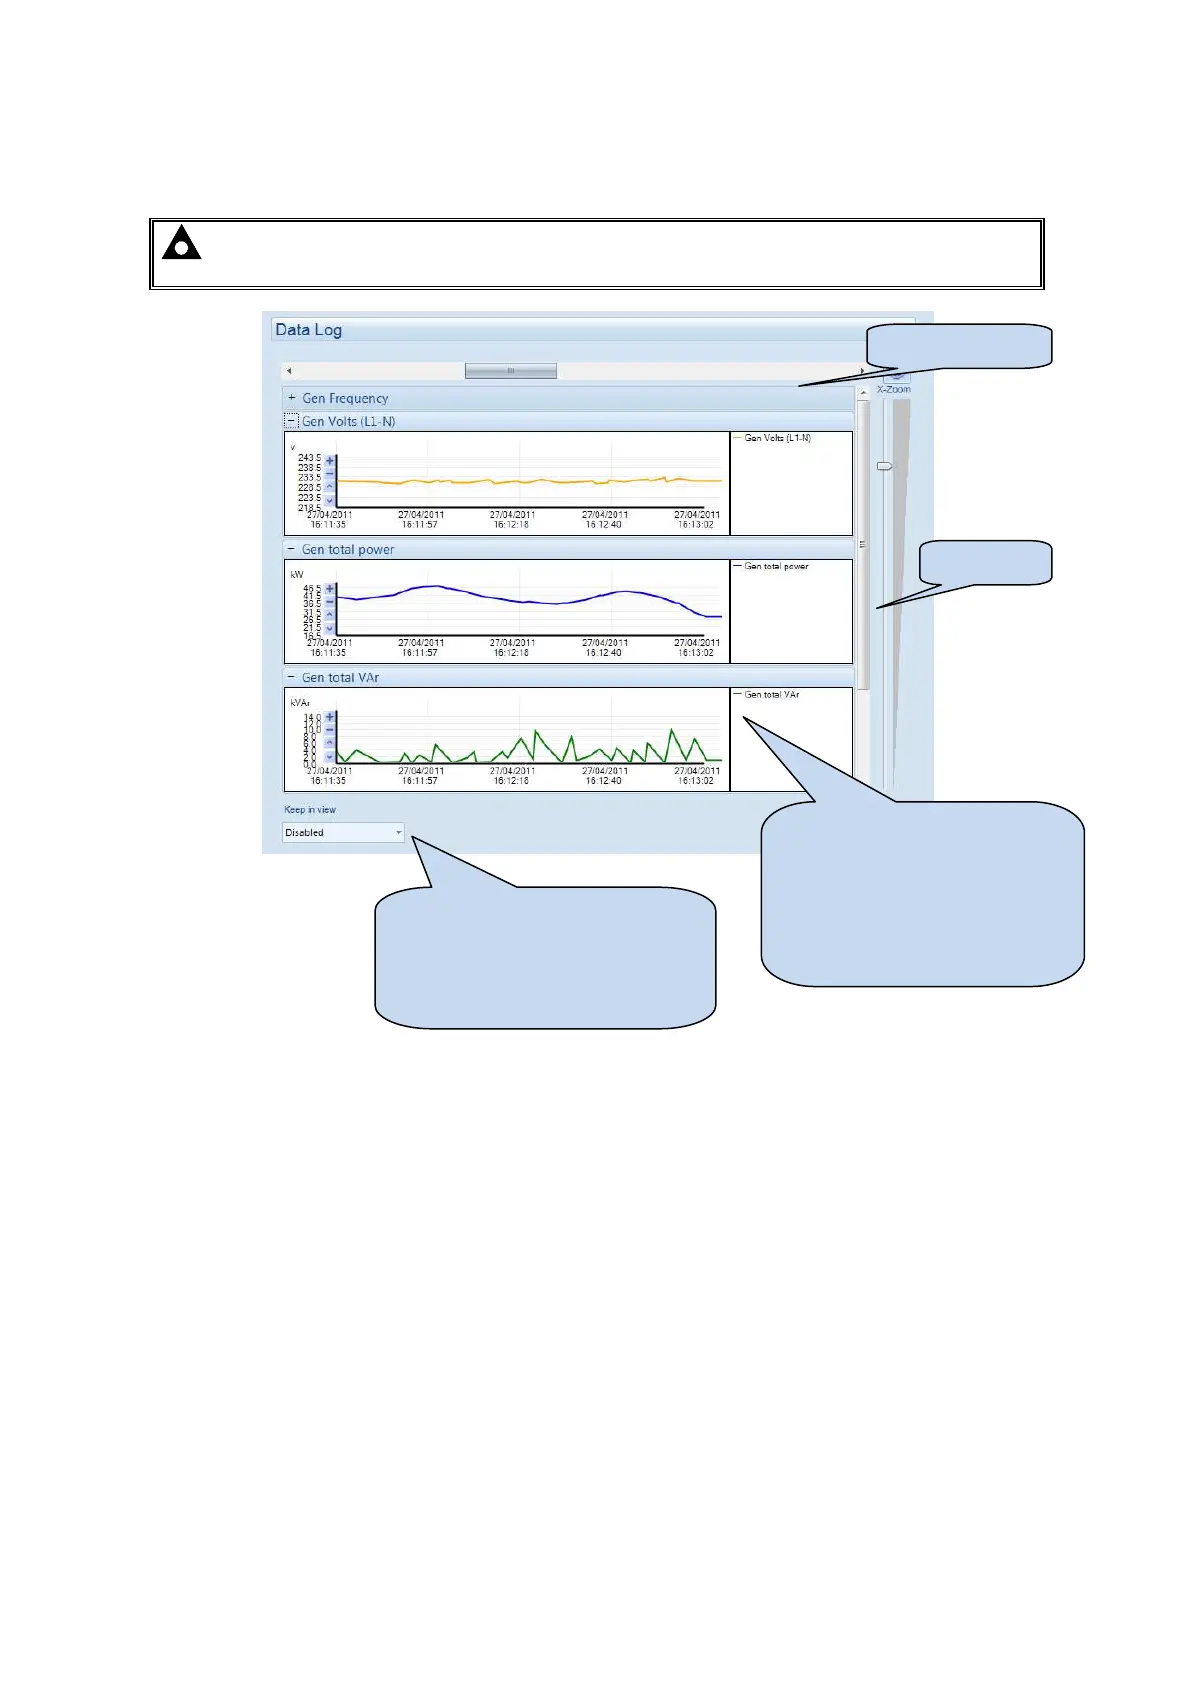
5.17 DATALOG
Allows viewing of the module datalog (if configured).
NOTE: - Data logging is a ‘live’ function – Maximum 8hrs duration is shown so long as the PC is
left connected to the controller.
Selects the timescale of the
displayed graphs.
Scroll bars on the graphs ‘x’ axis
can also be used to scroll the graph
backwards and forwards in time.
The data is automatically collated
and presented in the graphs.
For exampled Voltages are
displayed in the same graph, but
not mixed with kW for example,
which are shown on a separate
graph.
Zoom slider
Navigation sliders