3410 Series Gas Ultrasonic Meters Operations Manual Section 7: Tools commands
3-9000-777 Rev D June 2016
Navigate the waveform viewer 127
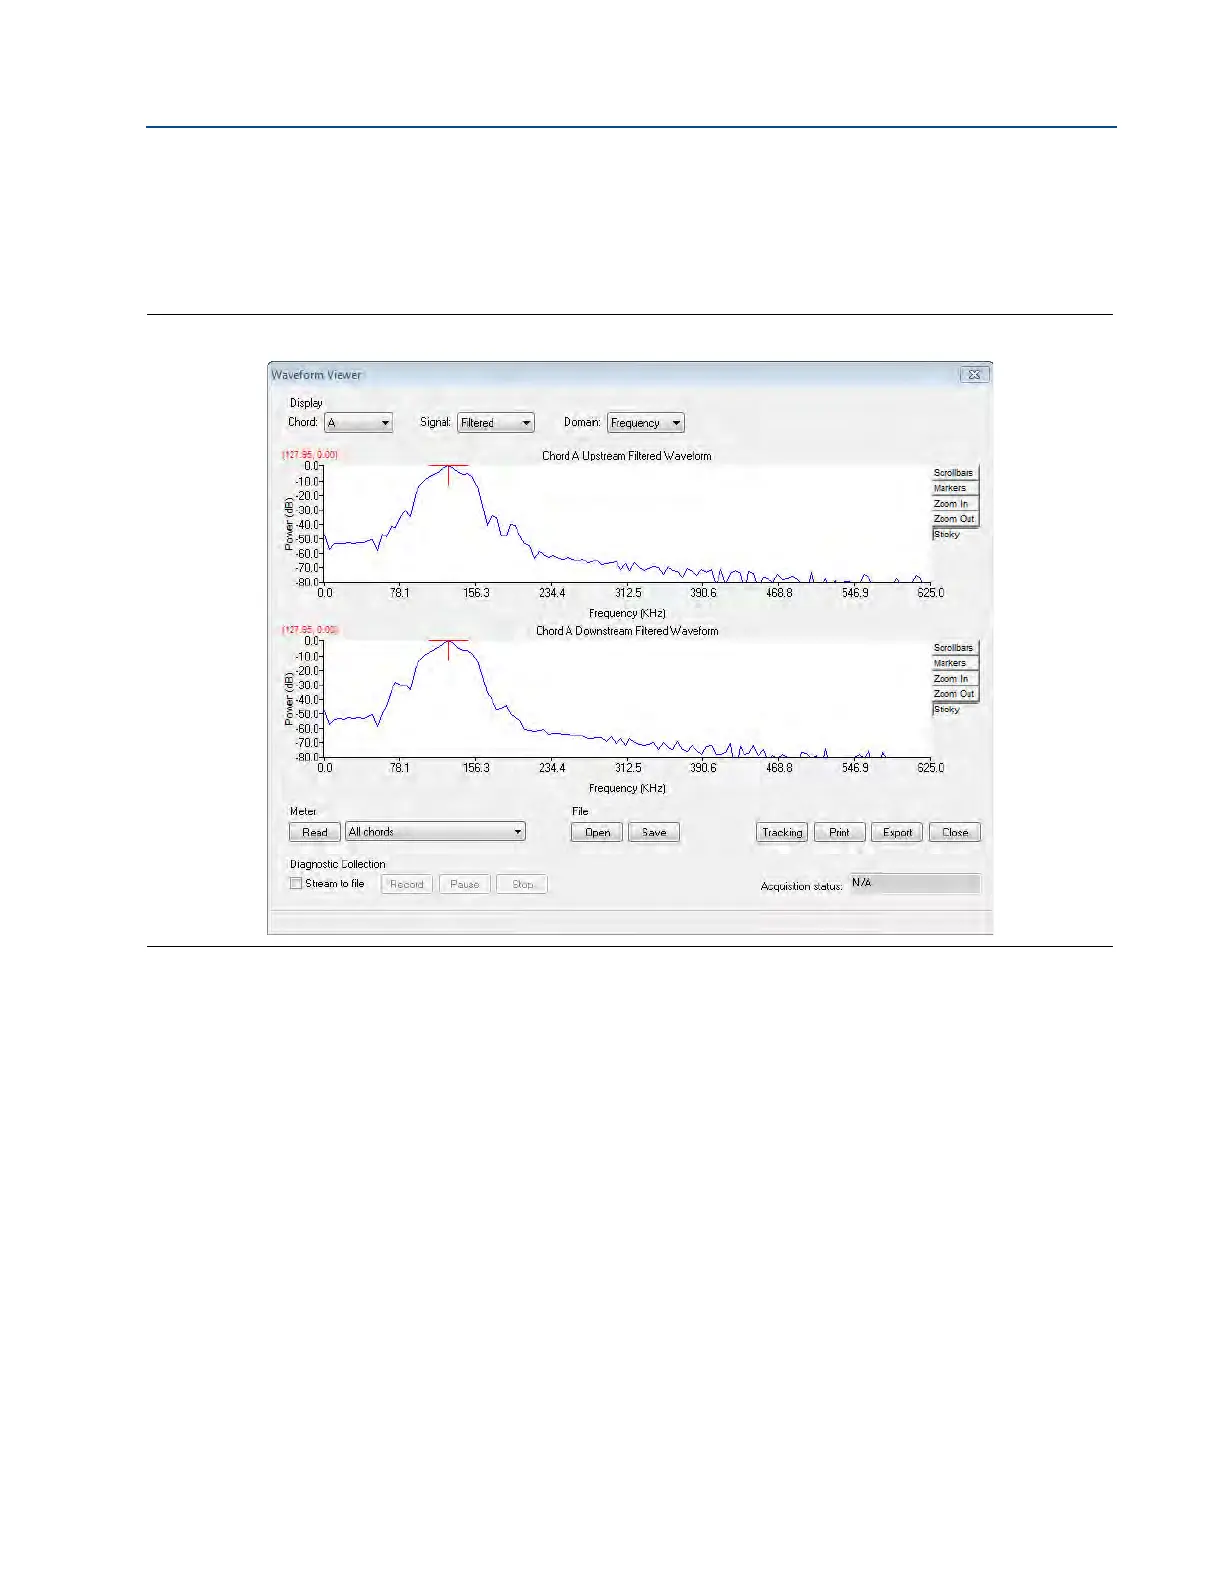
The waveforms may also be displayed in the frequency domain. In this mode a Fast Fourier
Transform is taken of the waveform so that the frequency content of the waveform can be
displayed. This can be useful in noisy environments to see the frequency of the noise and if it is in
the range of the transducer signal.
Figure 7-5 Waveform viewer - frequency domain
Zero crossing and first motion markers
Two markers display along the horizontal axis for either the Stacked or Filtered waveform. If
filtering is on, the markers will be on the Filtered waveform. If filtering is off, the markers will be
on the Stacked waveform. The green marker shows the point where the first motion is detected.
The purple marker shows the zero crossing which is the point that the meter uses as the arrival
point of the signal.
7.2.2 Navigate the waveform viewer
1. Select the waveforms to collect from the Meter box and click Read. Selections include:
• All Chords
• Chord A
• Chord B
• Chord C
• Chord D
2. Daniel MeterLink starts to continuously stream waveforms from the meter.
3. Click
Save while streaming waveforms or click Stop opens a Save As dialog box to allow
you to choose a name for the Waveform file.
 Loading...