Deltabar PMD75B HART Diagnostics and troubleshooting
Endress+Hauser 63
11.7 Event logbook
11.7.1 Event history
The Event list submenu provides a chronological overview of the event messages that
have occurred
4)
.
Navigation path
Diagnostics → Event logbook
A maximum of 100 event messages can be displayed in chronological order.
The event history includes entries for:
• Diagnostic events
• Information events
In addition to the operation time of the event occurrence, each event is also assigned a
symbol that indicates whether the event has occurred or is ended:
• Diagnostic event
• : Occurrence of the event
• : End of the event
• Information event
: Occurrence of the event
11.7.2 Filtering the event logbook
Using the Filter options parameter, you can define which category of event messages is
displayed in the Event list submenu.
Navigation path
Diagnostics → Event logbook → Filter options
Filter categories
• All
• Failure (F)
• Function check (C)
• Out of specification (S)
• Maintenance required (M)
• Information
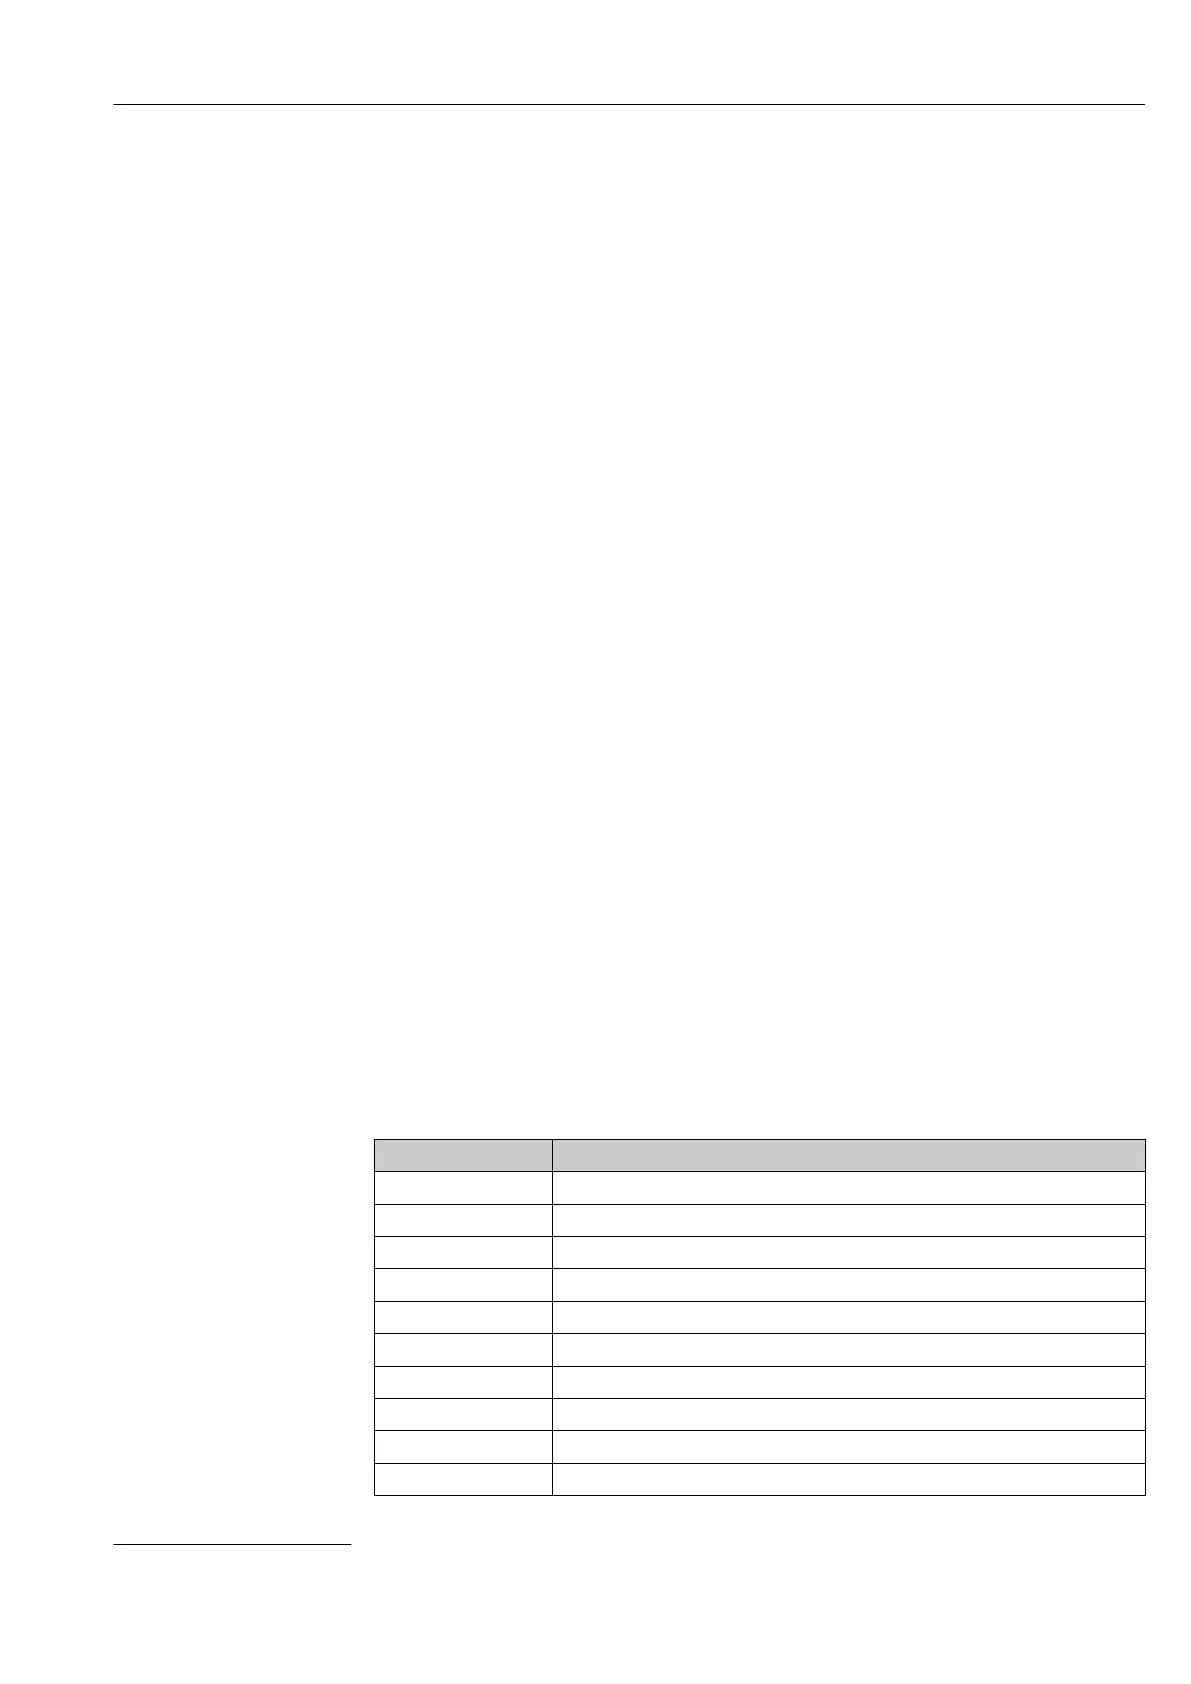
11.7.3 Overview of information events
Info number Info name
I1000 --------(Device ok)
I1079 Sensor changed
I1089 Power on
I1090 Configuration reset
I1091 Configuration changed
I11074 Device verification active
I1110 Write protection switch changed
I11104 Loop diagnostics
I1151 History reset
I1154 Reset terminal voltage min/max
4) If operating via FieldCare, the event list can be displayed with the "Event List/HistoROM" FieldCare function.
 Loading...