EasyManuals Logo

Endress+Hauser SpectraSensors SS2100i-1 User Manual

Endress+Hauser SpectraSensors SS2100i-1
114 pages
To Next Page IconTo Next Page
To Previous Page IconTo Previous Page
Page #71 background imageLoading...
Page #71 background image
Serial Port Communications
Operator’s Manual 3
11
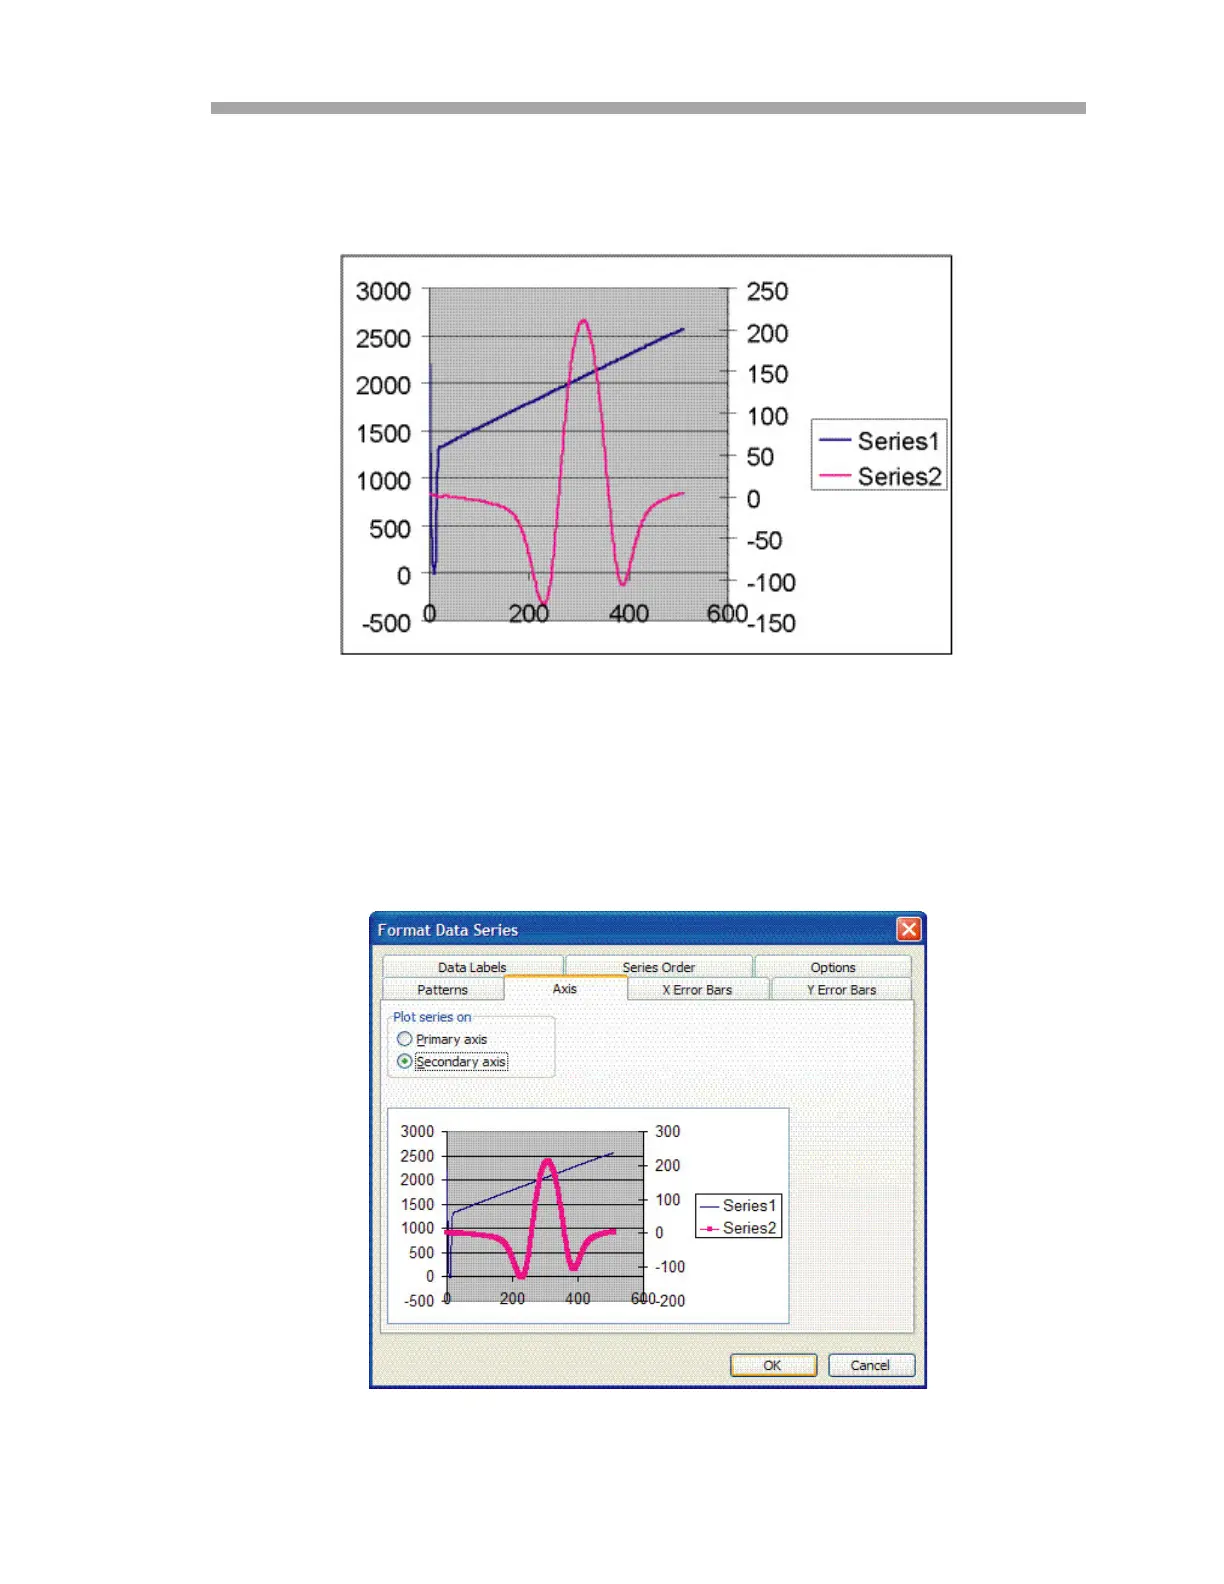
6. Choose the X-Y (Scatter) chart type and the Smoothed Lines
Without Markers sub-type. Click Finish to display a graph of the
spectrum, as shown in Figure 3–11 below.
7. If the 2f curve appears flat, double click on it to get to the Format
Data Series Window, as shown in Figure 3–12 below. Select the
Axis tab, and select Plot Series on Secondary Axis. Click OK to
rescale the plot.
Figure 3–11 Data file plot in Excel
Figure 3–12 Format Data Series window

Table of Contents

Other manuals for Endress+Hauser SpectraSensors SS2100i-1

Questions and Answers:

Question and Answer IconNeed help?

Do you have a question about the Endress+Hauser SpectraSensors SS2100i-1 and is the answer not in the manual?

Endress+Hauser SpectraSensors SS2100i-1 Specifications

General IconGeneral
BrandEndress+Hauser
ModelSpectraSensors SS2100i-1
CategoryMeasuring Instruments
LanguageEnglish

Related product manuals