19
212
Eversense E3 CGM User Guide
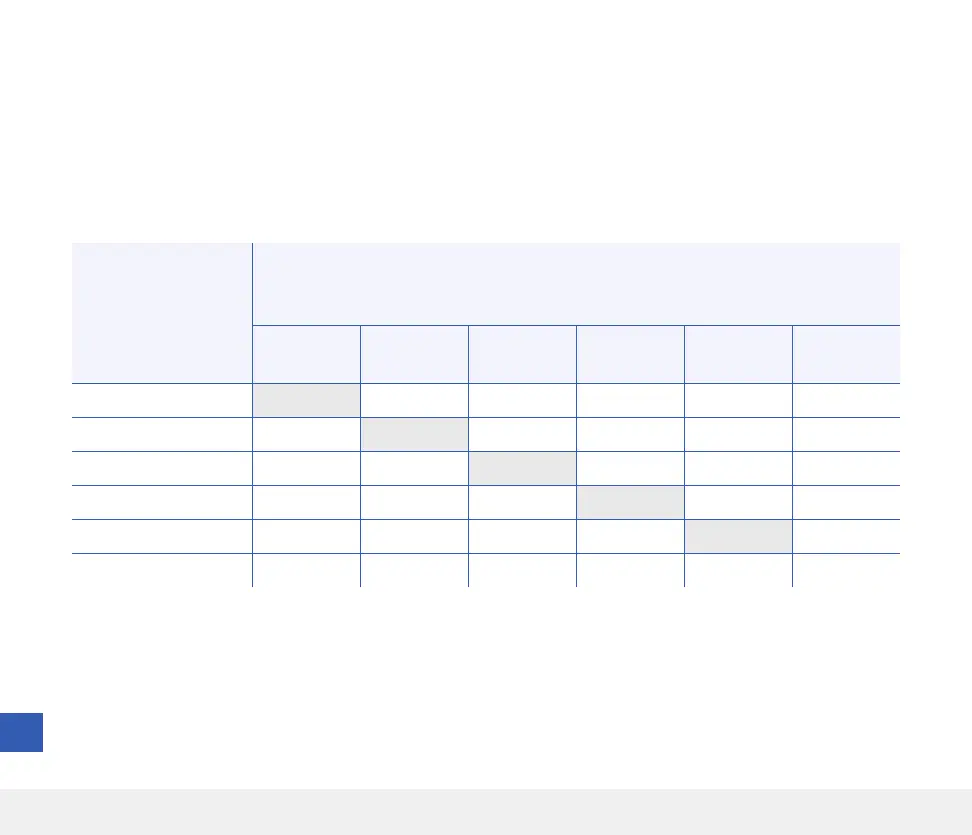
Table 7 – Eversense E3 Rate of Change Trend Agreement in the PROMISE Study
Reference Rate of Change (mg/dL/min)
Percent of Matched Pairs in Each Reference
Trend Range for Each CGM ROC Range
CGM Trend
(mg/dL/min)
< -2 [-2, -1) [-1, 1] (1, 2] > 2 Total
< -2 24% 35% 41% 0% 0% 163
[-2, -1) 4% 36% 59% 0% 0% 824
[-1, 1] 0% 4% 90% 5% 1% 8,716
(1, 2] 0% 1% 46% 42% 11% 896
> 2 0% 0% 24% 40% 35% 336
10,935
Eversense E3 Rate of Change Trend Agreement
The shaded area in the table below shows agreement between the Eversense E3 glucose trends and the YSI
reference trends while glucose is trending at dierent rates (mg/dL per minute). As an example, when glucose
is trending at a rate of between -1 and 1 mg/dL/minute, Eversense E3 glucose trends are in agreement with the
reference trends 90% of the time.