19
215
Eversense E3 CGM User Guide
215
Eversense E3 CGM User Guide
Calibration Stability Agreement
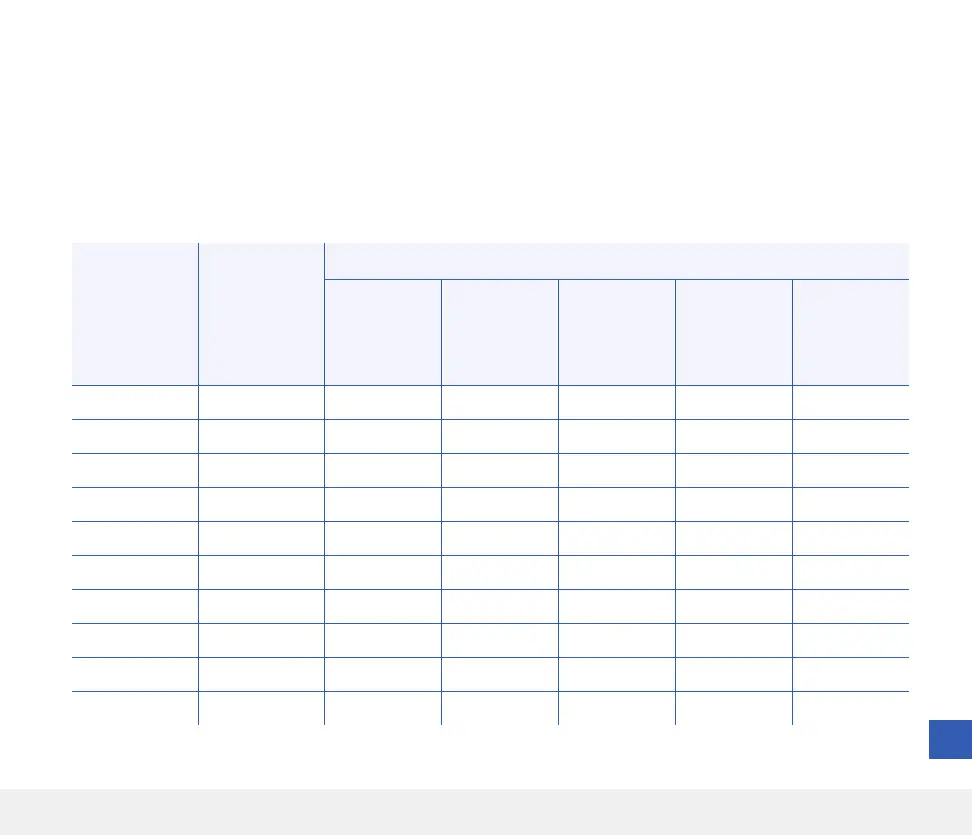
The table below compares the percentage of sensor glucose values to the YSI reference at various time points after
a calibration entry. As an example, in the table below, 89.7% of the Eversense E3 values were within 15 mg/dL (for
reference readings of 80 mg/dL or less), and within 15% (for reference readings over 80 mg/dL) of the reference value
8 to 10 hours after a calibration entry.
Table 10 – Eversense E3 Calibration Stability Agreement in the PROMISE Study
Percent of CGM System Readings Within
Time
from
Calibration
Number
of Paired
CGM-YSI
Percent
15/15%
of
Reference
Percent
20/20%
of
Reference
Percent
30/30%
of
Reference
Percent
40/40%
of
Reference
Percent
> 40/40%
of
Reference
(0, 2) Hours 2,638 88.8 94.1 98.7 99.9 0.1
[2, 4) Hours 1,905 87.2 94.4 98.5 99.5 0.5
[4, 6) Hours 1,404 85.3 93.3 98.1 99.3 0.7
[6, 8) Hours 1,043 83.0 91.5 97.7 99.6 0.4
[8, 10) Hours 1,041 89.7 93.9 98.8 99.6 0.4
[10, 12) Hours 1,091 87.8 94.1 97.7 99.5 0.5
[12, 14) Hours 590 85.8 93.4 99.0 99.3 0.7
[14, 16) Hours 440 82.7 91.8 100.0 100.0 0.0
[16, 18) Hours 379 87.6 93.9 99.5 100.0 0.0
[18, 20) Hours 370 90.0 97.0 98.4 99.7 0.3