Operation Instructions
Operation
2
2-13
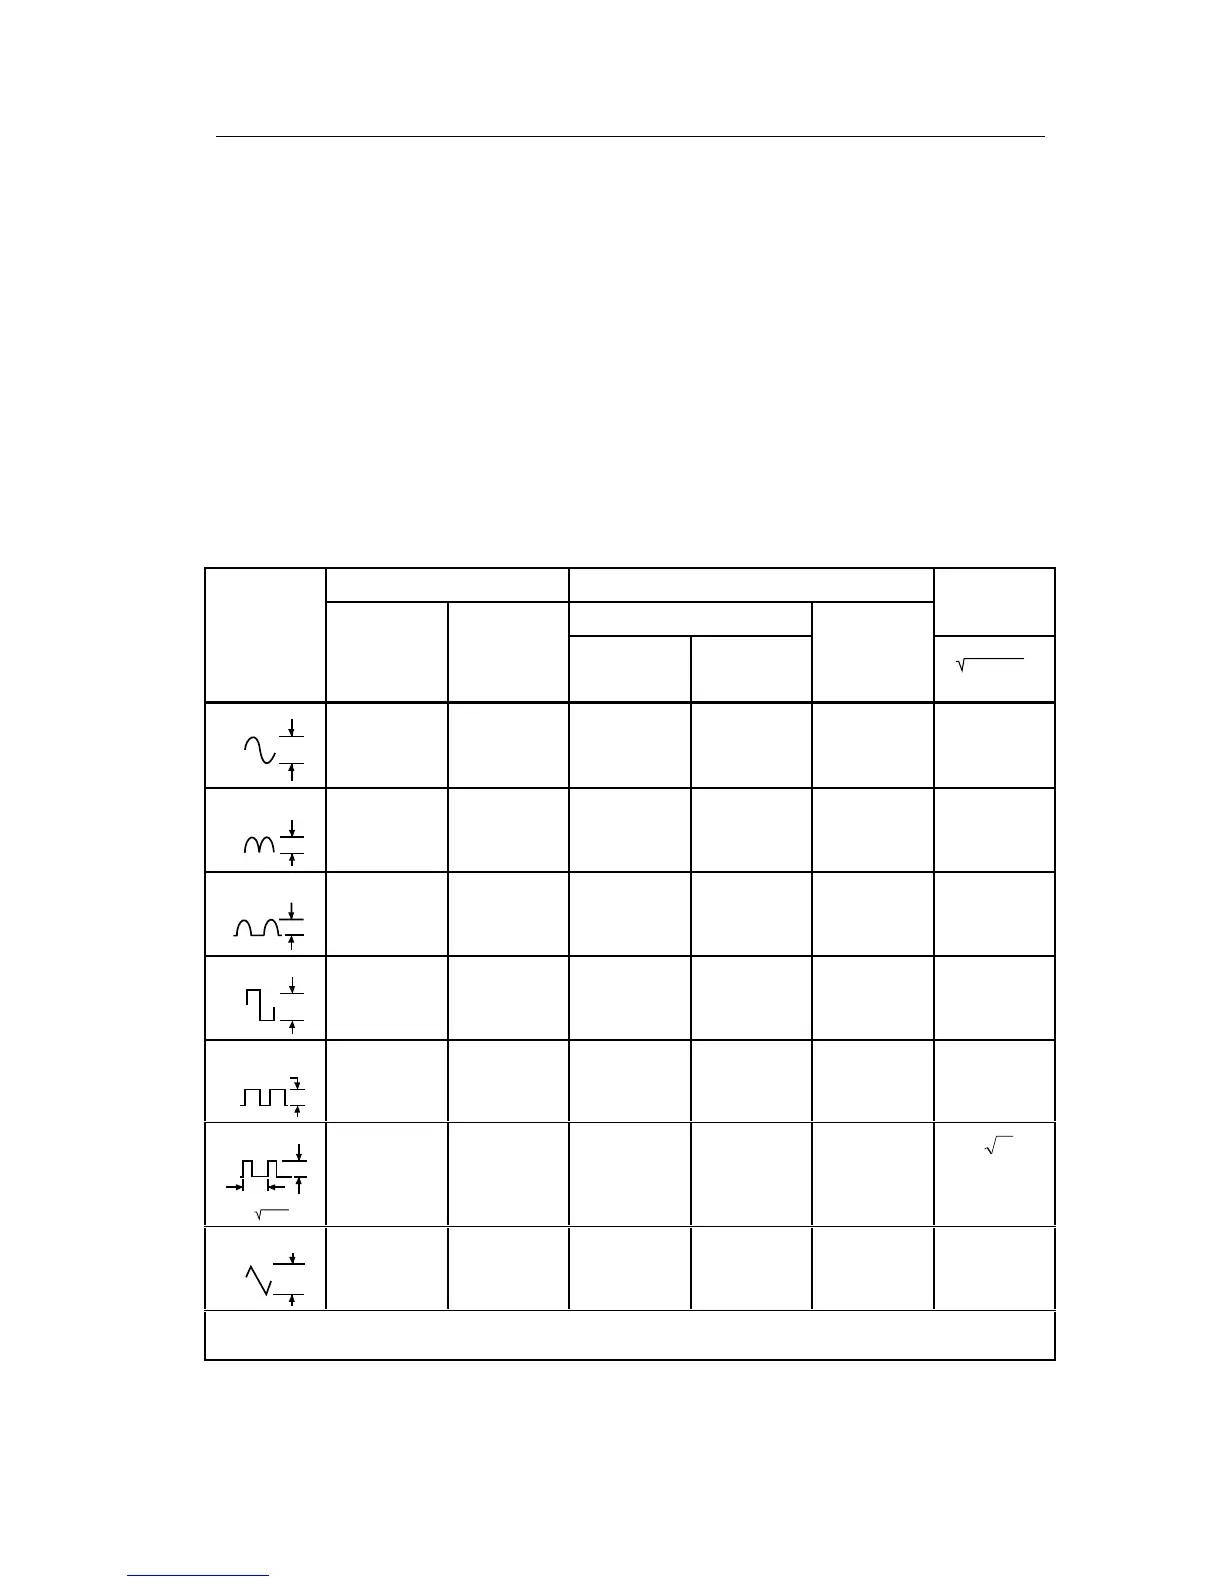
2-14. Waveform Comparison and Conversion
Figure 2-8 shows the relationship between common waveforms and the
display readings for the 8062A and average-responding meters. Figure 2-8
also illustrates the relationship between ac and dc measurements for ac-
coupled meters. For example, consider the first waveform, a 1.414V (0-pk)
sinewave. Both the 8062A and the rms-calibrated average-responding meter
display the correct rms reading of 1.000V (the dc component equals 0).
However, consider the 1.414V (0-pk) rectified square wave. Both types of
meters correctly measure the dc component (0.707V). But only the 8062A
correctly measures the ac component (0.707V). The average-responding
meter measures 0.785V, which amounts to a 5.6% error in the total rms
measurement calculated from the ac and dc components.
AC Coupled Peak Voltages Display Readings DC and AC
Input AC Component Only DC Total RMS
Waveform PK - PK 0 - PK
RMS CAL* 8062A
Component
only
TRUE RMS =
ac + dc
22
Sine
PK
0
PK-PK
2.828 1.414 1.000 1.000 0.000 1.000
PK-PK
0
PK
Rectified Sine
(Full Wave)
1.414 1.414 0.421 0.435 0.900 1.000
PK-PK
Rectified Sine
(Half Wave)
0
PK
2.000 2.000 0.764 0.771 0.636 1.000
PK-PK
0
PK
Square
2.000 1.000 1.110 1.000 0.000 1.000
PK-PK
0
PK
Rectified
Square
1.414 1.414 0.785 0.707 0.707 1.000
PK-PK
Rectangular
Pulse
0
PK
X
Y
D = X/Y
K = D-D
2
2.000 2.000 2.22K 2K 2D 2
D
PK-PK
Triangle
Sawtooth
0
PK
3.464 1.732 0.960 1.000 0.000 1.000
RMS CAL is the displayed value for average responding meters that are calibrated to display RMS for sine waves.
Figure 2-8. Multiplication Factors for Converting Waveforms