English (GB)
20
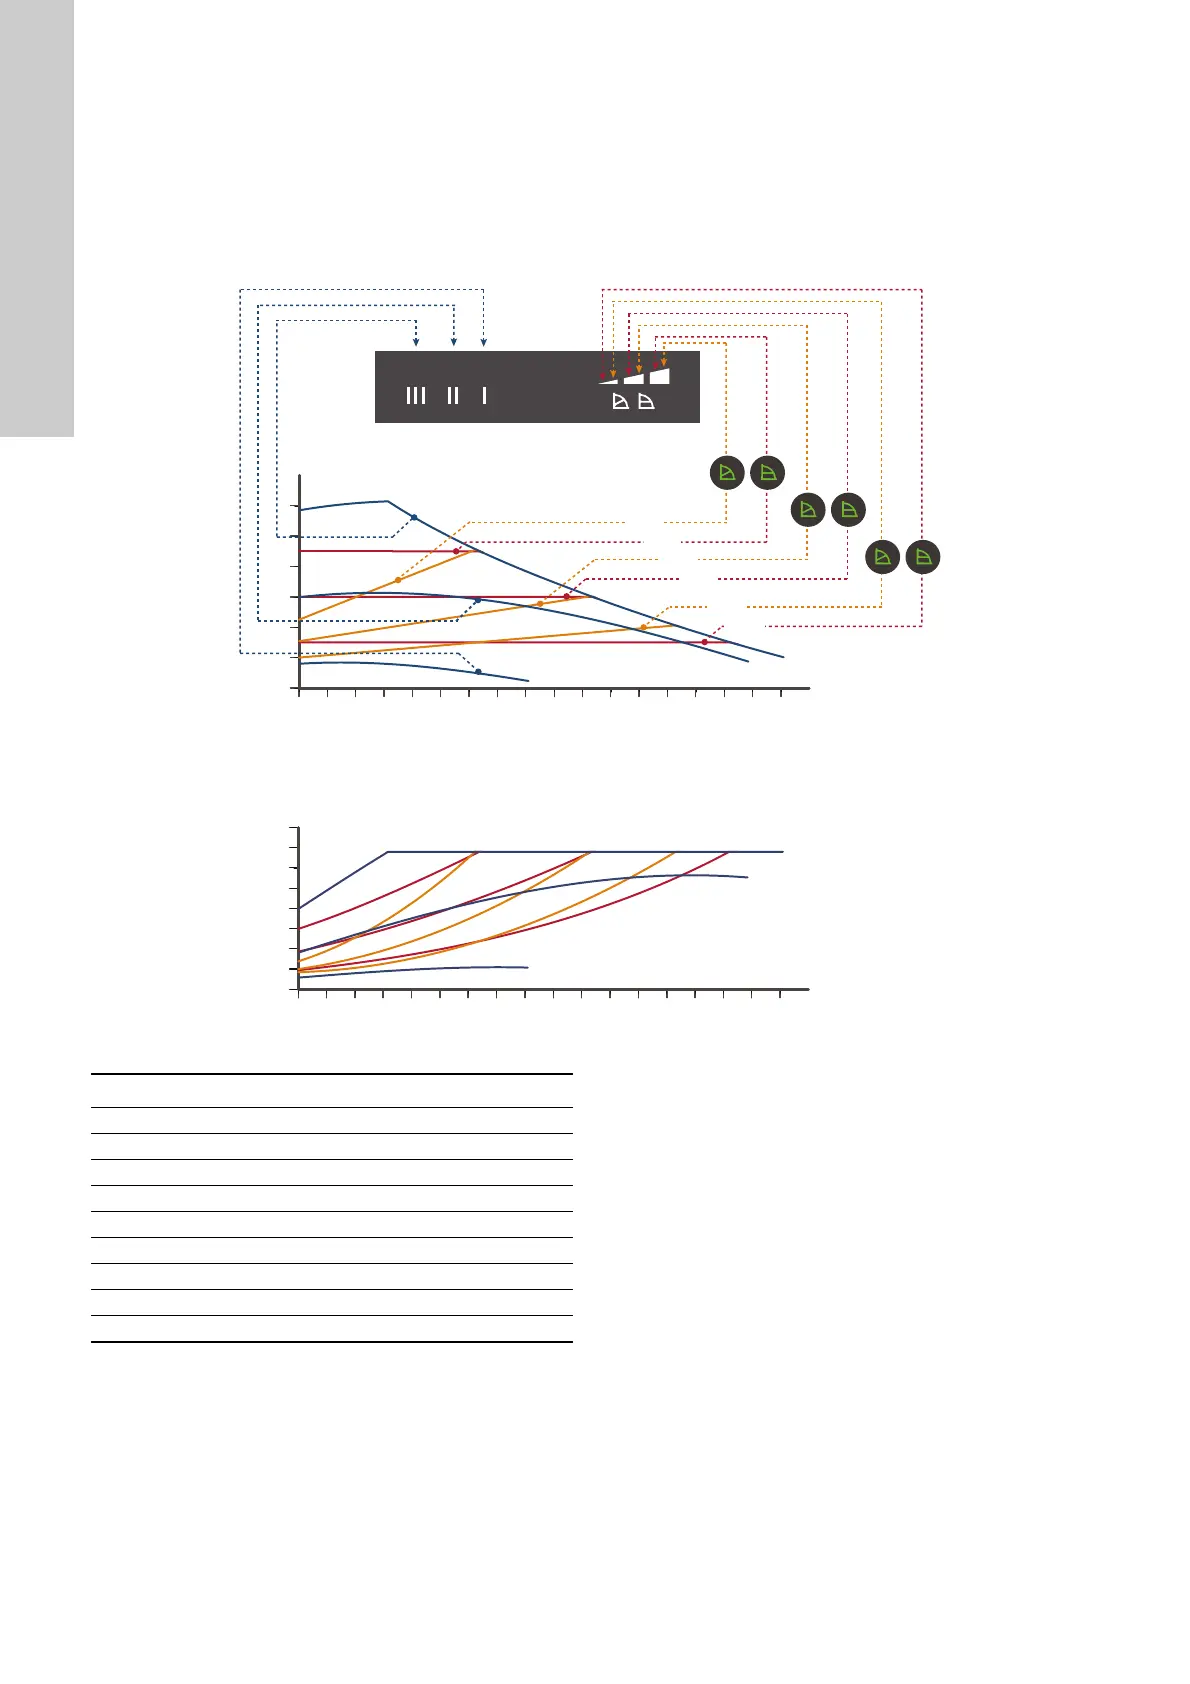
10. Performance curves
10.1 Guide to performance curves
Each pump setting has its own performance curve.
A power curve, P1, belongs to each performance curve. The
power curve shows the pump power consumption in watt at a
given performance curve.
The P1 value corresponds to the value that you can read from the
pump display. See fig. 26.
Fig. 26 Performance curves in relation to pump setting
For further information about pump settings, see this section:
7. Control functions
10.2 Curve conditions
The guidelines below apply to the performance curves on the
following pages:
• Test liquid: airless water.
• The curves apply to a density of 983.2 kg/m
3
and a liquid
temperature of 60 °C.
• All curves show average values and must not be used as
guarantee curves. If a specific minimum performance is
required, individual measurements must be made.
• The curves for speeds I, II and III are marked.
• The curves apply to a kinematic viscosity of 0.474 mm
2
/s
(0.474 cSt).
• Curves are obtained according to EN 16297.
TM07 0037 3917
III
II
I
Q
P1
H
III
II
I
PP3
CP3
CP2
PP1
CP1
PP2
Q
Setting Pump curve
PP1 Lowest proportional-pressure curve
PP2 Intermediate proportional-pressure curve
PP3 Highest proportional-pressure curve
CP1 Lowest constant-pressure curve
CP2 Intermediate constant-pressure curve
CP3 Highest constant-pressure curve
III Constant curve or constant speed III
II Constant curve or constant speed II
I Constant curve or constant speed I