21
Before starting Installation
Operation
Screen block
diagram
Function setting Program System setting Specifications
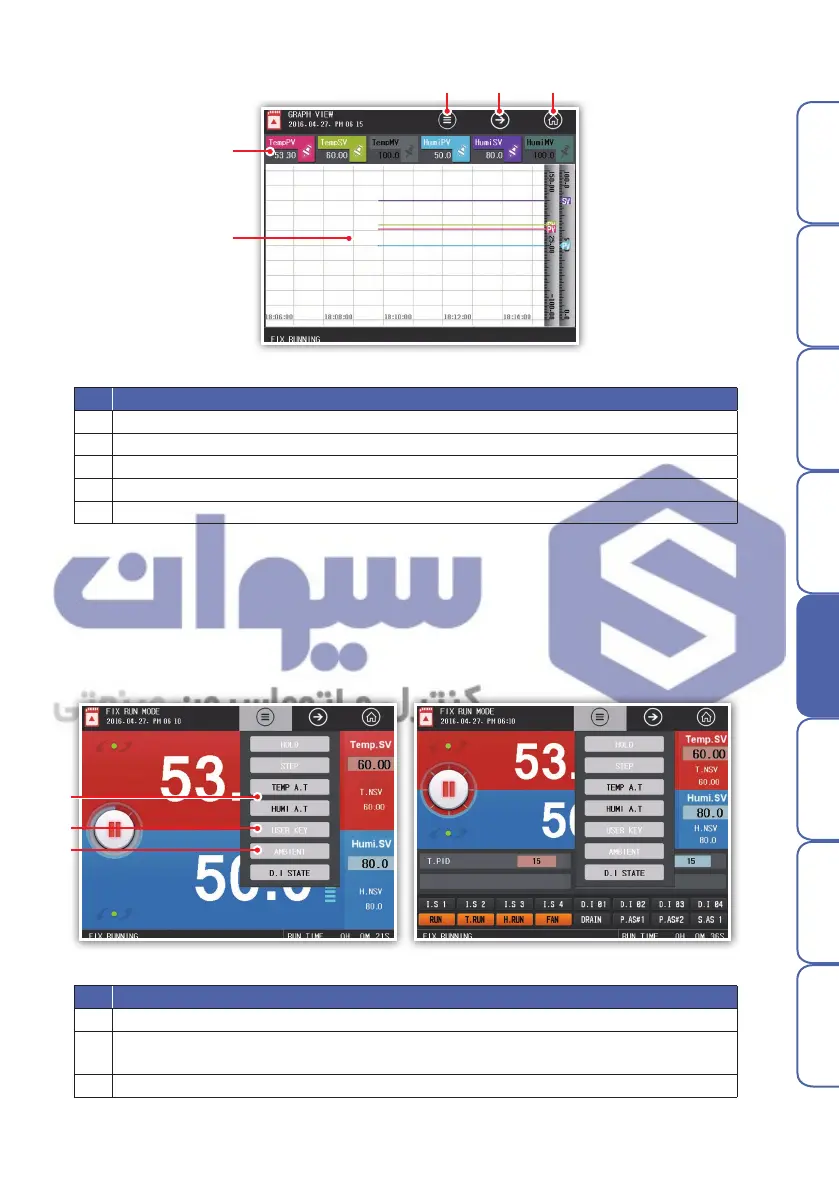
NO. Description
1 Run hidden menu pane. Click the same to hide menu pane.
2 Go to constant-value operation 1 window.
3 Go to main menu screen.
4
Display measurement, setting value, and output of currently operating channel through a graph.
5 Set the data display with the check box. Graph is not displayed with OFF selected.
No. Description
1
When the auto tuning is in execution, it runs with current setting values.
2
Press User-defined button to run assigned relay in
[Main menu] – [System menu] – [DO configuration].
3 Go to DI state check screen.
Fig. 13) Fixed control screen3
Fig. 14) Fixed control screen 1 menu window
Fig. 14) Fixed control screen 2 menu window
▶ Fixed control screen 3
▶ Fixed control screen menu window
① ② ③
⑤
④
①
②
③
User can set background color(white/black), drawing(line and dot), and line thickness(1 or 2 pixels) of graph.
It can be changed in [Main menu] - [Operation setting] - [Graph].
※Once the operation is started, the graph is being drawn accordingly. The flow speed depends on the save interval.
هﺮﮐ ﮓﻧﺎﯿﻧﺎﻫ تﻻﻮﺼﺤﻣ یرﺎﺼﺤﻧا هﺪﻨﯾﺎ ناﻮﯿﺳ ﺖﮐﴍ
 Loading...