mixer
spur.
Verify that this
spur
is
at
least
60
dB
below
the
fundamental.
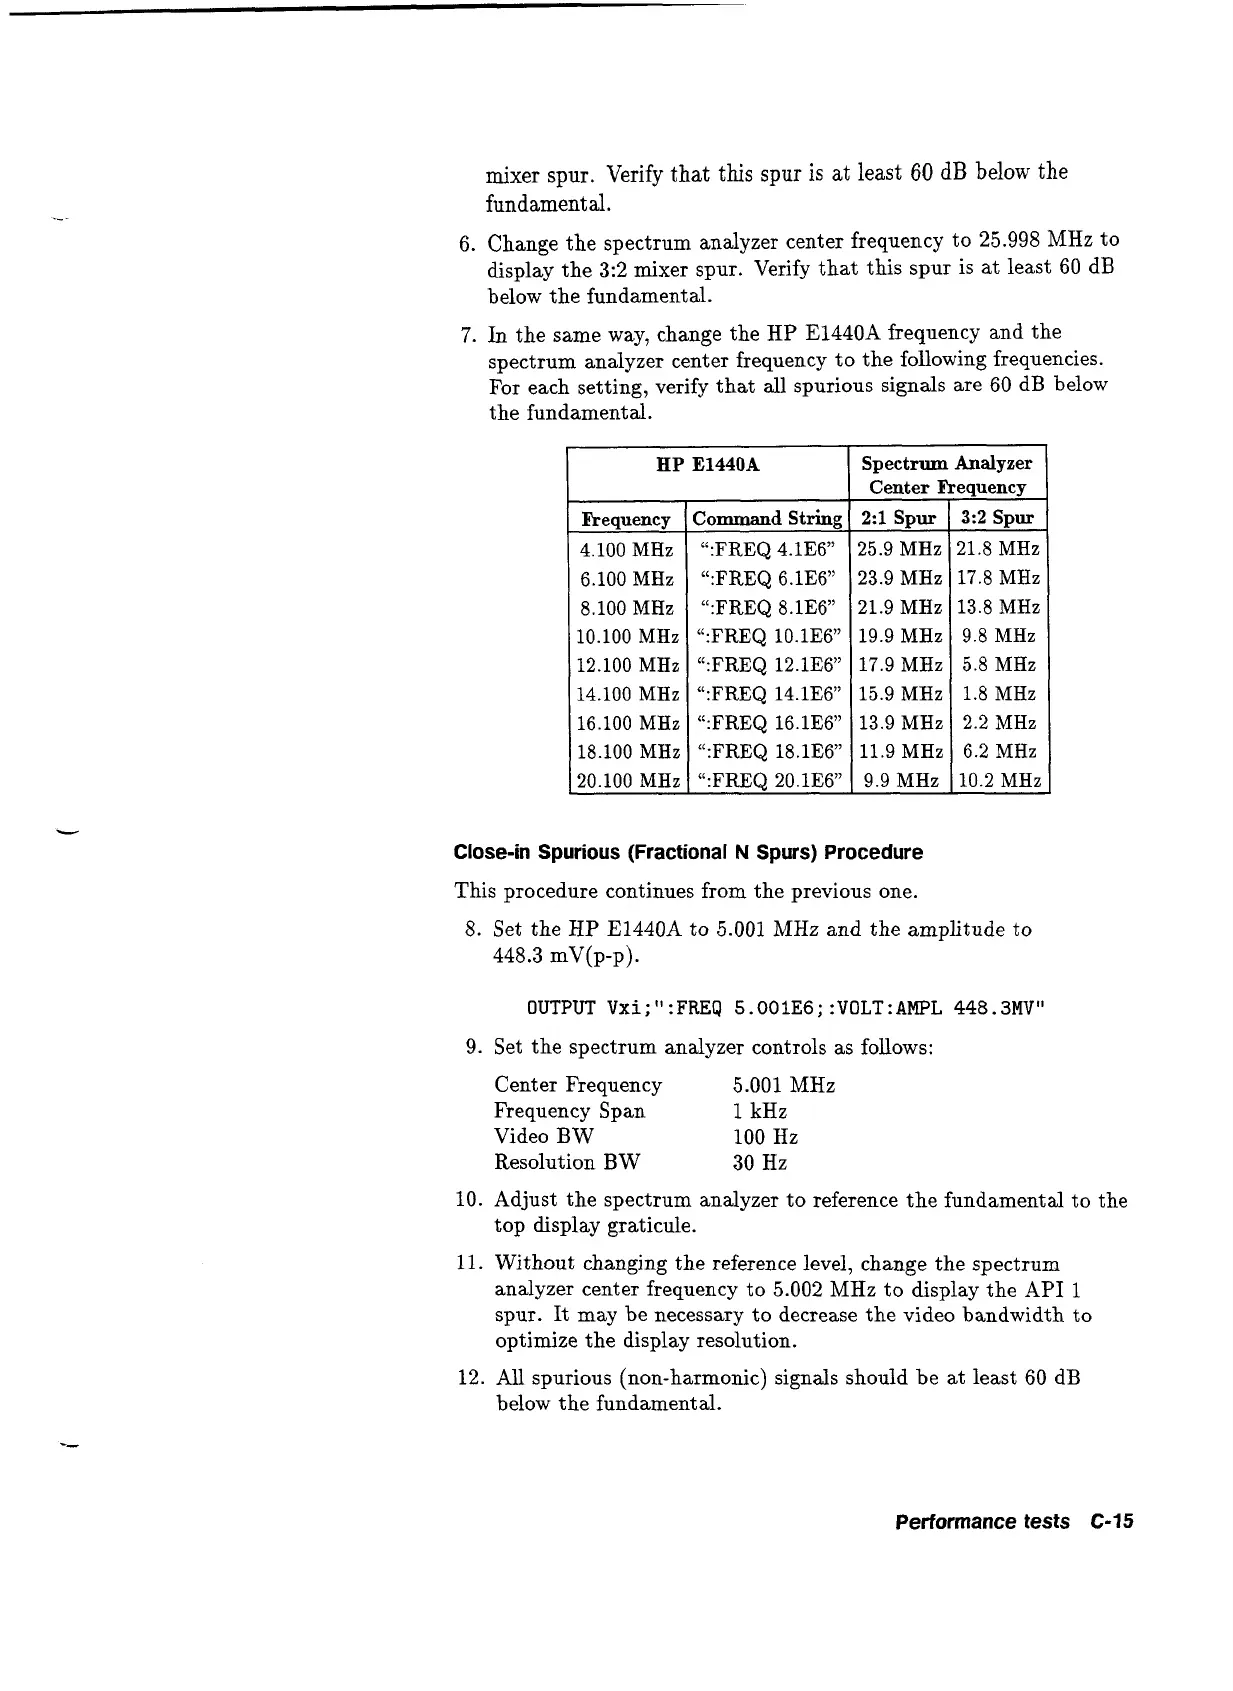
6. Change the spectrum analyzer center frequency to 25.998 MHz to
display the 3:2 mixer spur. Verify that this spur is at least 60 dB
below the fundamental.
7.
In
the same way, change the HP E1440A frequency and the
spectrum analyzer center frequency to the following frequencies.
For each setting, verify that
all
spurious signals are 60 dB below
the fundamental.
Spectrum Analyzer
Frequency
4.100 MHz
6.100 MHz
8.100 MHz
10.100 MHz
12.100 MHz
14.100 MHz
16.100 MHz
18.100 MHz
20.100 MHz
Center
E
2:l Spur
25.9 MHz
23.9 MHz
21.9 MHz
19.9 MHz
17.9 MHz
15.9 MHz
13.9 MHz
11.9 MHz
9.9 MHz
Command
String
":FREQ 4.1E6"
":FREQ 6.1E6"
":FREQ 8.1E6"
":FREQ 10.1E6"
":FREQ 12.1E6"
ll:FREQ 14.1E6"
":FREQ 16.1E6"
":FREQ 18.1E6"
":FREQ 20.1E6"
'quency
3:2
Spur
21.8 MHz
17.8 MHz
13.8 MHz
9.8 MHz
5.8 MHz
1.8 MHz
2.2 MHz
6.2 MHz
10.2 MHz
Close-in Spurious (Fractional
N
Spurs) Procedure
This procedure continues from the previous one.
8. Set the
HP
E1440A to 5.001 MHz and the amplitude to
448.3 mV(p-p).
OUTPUT Vxi;":FREQ S.OOIE6;:VOLT:AMPL 448.3MV1'
9. Set the spectrum analyzer controls as follows:
Center Frequency 5.001 MHz
Frequency Span
1
kHz
Video BW
100
Hz
Resolution B W 30 Hz
10. Adjust the spectrum analyzer to reference the fundamental to the
top display graticule.
11.
Without changing the reference level, change the spectrum
analyzer center frequency to 5.002 MHz to display the API
1
spur. It may be necessary to decrease the video bandwidth to
optimize the display resolution.
12. All spurious (non-harmonic) signals should be at least 60 dB
below the fundamental.
Performance
tests
C-15
Artisan Technology Group - Quality Instrumentation ... Guaranteed | (888) 88-SOURCE | www.artisantg.com
 Loading...