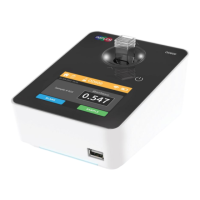
Implen OD600
®
User Manual Version 1.0
27
Calculations
The McFarland concentration is calculated using a basic linear regression standard curve.
This plot is described by the equation of a line: y=mx+b where:
y is the response variable (measured response),
x is the explanatory variable (concentration),
m is the slope of the line,
b is the y-intercept.
A line of best-fit is then used for concentration determination. Once the equation/curve is programmed, the unknown
concentration/MFU value is calculated based on these values.