60 Chapter 8: ChartView & ChartView Plus TempScan / MultiScan User's Manual
Channel Information Region
Channels can return values in units of °C, °F, °K, °R, mV, V,
or user defined units (if the mX + b option is used). With
exception of mX + b user defined units, units depend on the
configuration and type of signal conditioning card used.
Signal conditioning cards are detailed in the user’s manual for
you data acquisition device. The Channel Information Region
is located on the right-hand side of ChartView’s main
window. The values displayed in this region are the real-time
values of the selected channel.
By clicking on the up or down arrows (
σ
, or
τ
) by the channel
selection box (item 14), you can select one of a maximum of 4
channels that were assigned to that chart. You could then
observe the chart-related information for that specific channel.
You can also select a new channel for the information region
by placing the cursor in (or tabbing over to) the “Center” or
“Units/Div” fields and then pressing PageUp or PageDown. This is particularly useful when your
main window has been re-sized such that the channel selection boxes are not visible.
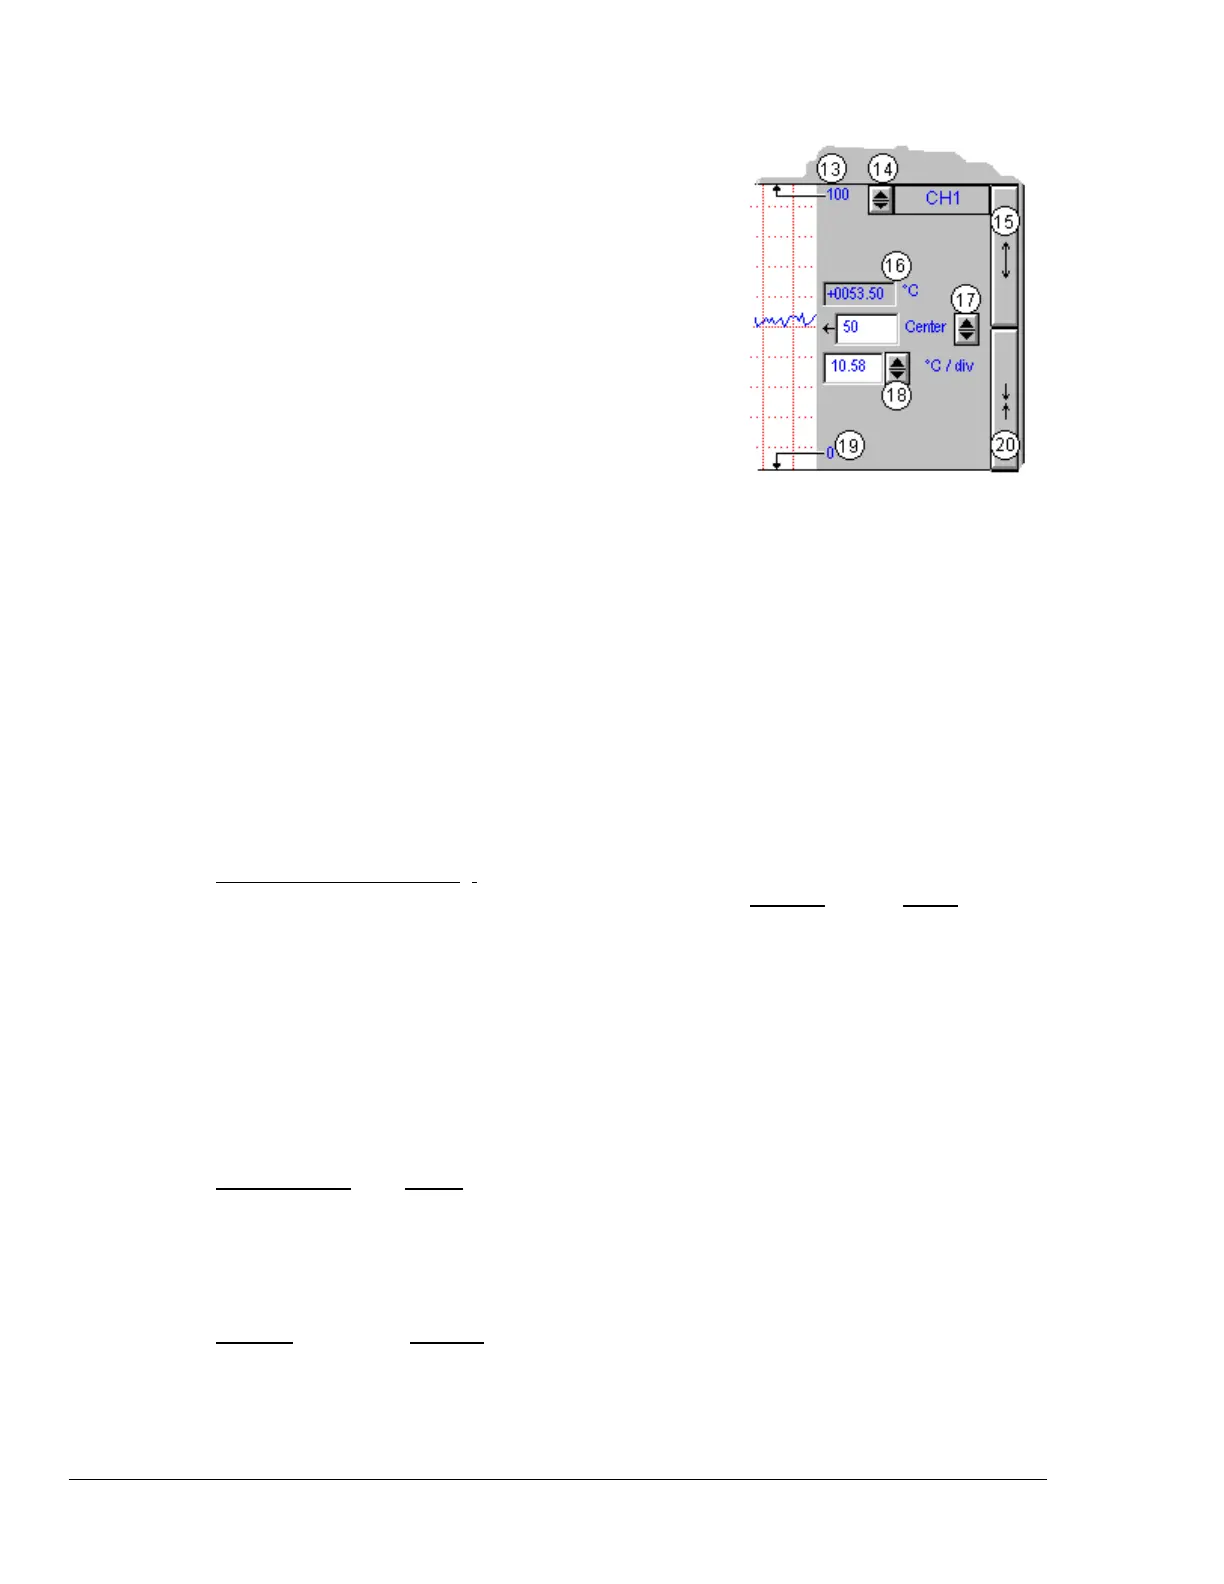
The following list identifies the various areas of the region.
13 Chart Max. Scale Value
(Grid Limit Line)
17 Center
(Value at chart mid-line)
14 Channel Selection
(Of chart’s available channels)
18 Units/Division
(Provides the vertical increment of one grid box.)
15 Multiply (x2) 19 Chart Min. Scale Value (Grid Limit Line)
16 Present Value 20 Divide (÷2)
Note: The basic ChartView program does not permit overlapping channels or having more than
1 chart group. Multiple group applications (ChartView Plus) can be activated by use of a
special code, allowing up to 4 overlapping channels per chart. Regardless of whether you are
using the basic ChartView program, or ChartView Plus, there is a maximum limit of 16 charts
per group.
Multiply and Divide Buttons -
In addition to reading channel values, you can increase or decrease the
size of the selected channel’s chart. This is accomplished with the Multiply (15) and Divide (20)
push-buttons. The Multiply push-button effectively increases the size of the selected channel’s chart by
a factor of 2, while automatically adjusting the chart’s high and low values (items 13 and 19). Aside
from “clicking” on the Multiply/Divide controls, you can use your keyboard spacebar to control this
feature once the button (15 or 20) is selected. Selection may be with mouse, or by tabbing over to the
control.
Making changes to a channel’s chart parameters does not affect the parameters of the other channels,
with the following exception: Holding the keyboard’s control key down while adjusting either spinner
(
σ
/
τ
) for center (item 17), or spinner for units/div (item 18) causes the parameter change to apply to all
channels displayed for the chart, not just the currently selected channel display. This feature applies to
the spinners and keyboard up and down arrow keys, but not to the text input.
Center Control - The Center
control (item 17) changes the value of the selected channel’s chart
centerline. Changing the value of center results in an automatic change of the chart’s high and low end
values (items 13 and 19), and possibly an automatic change of the units/div (item 18). Aside from
using the center spinner controls to change center, you can change the center value by placing the
mouse cursor in (or tabbing over to) the field and then either typing in the desired value, or using the
PC keyboard up and down arrow control keys.
Units/div - The units in units/div
(18) can be °C, °F, °K, °R, mV, or V. The division referenced is one
vertical grid. In the example above for Channel 1, each vertical grid increment represents 10.58°C per
division. Changing the units/division spinner controls (
σ
/
τ
) will result in an automatic adjustment of the
max scale and min scale values (items 13 and 19). Aside from using the units/div triangular controls to
change the value, you can change units/div by placing the mouse cursor in (or tabbing over to) the field
and then either typing in the desired value, or using the PC keyboard arrow control keys.



 To Next Page