62 Chapter 8: ChartView & ChartView Plus TempScan / MultiScan User's Manual
Main Window Toolbar
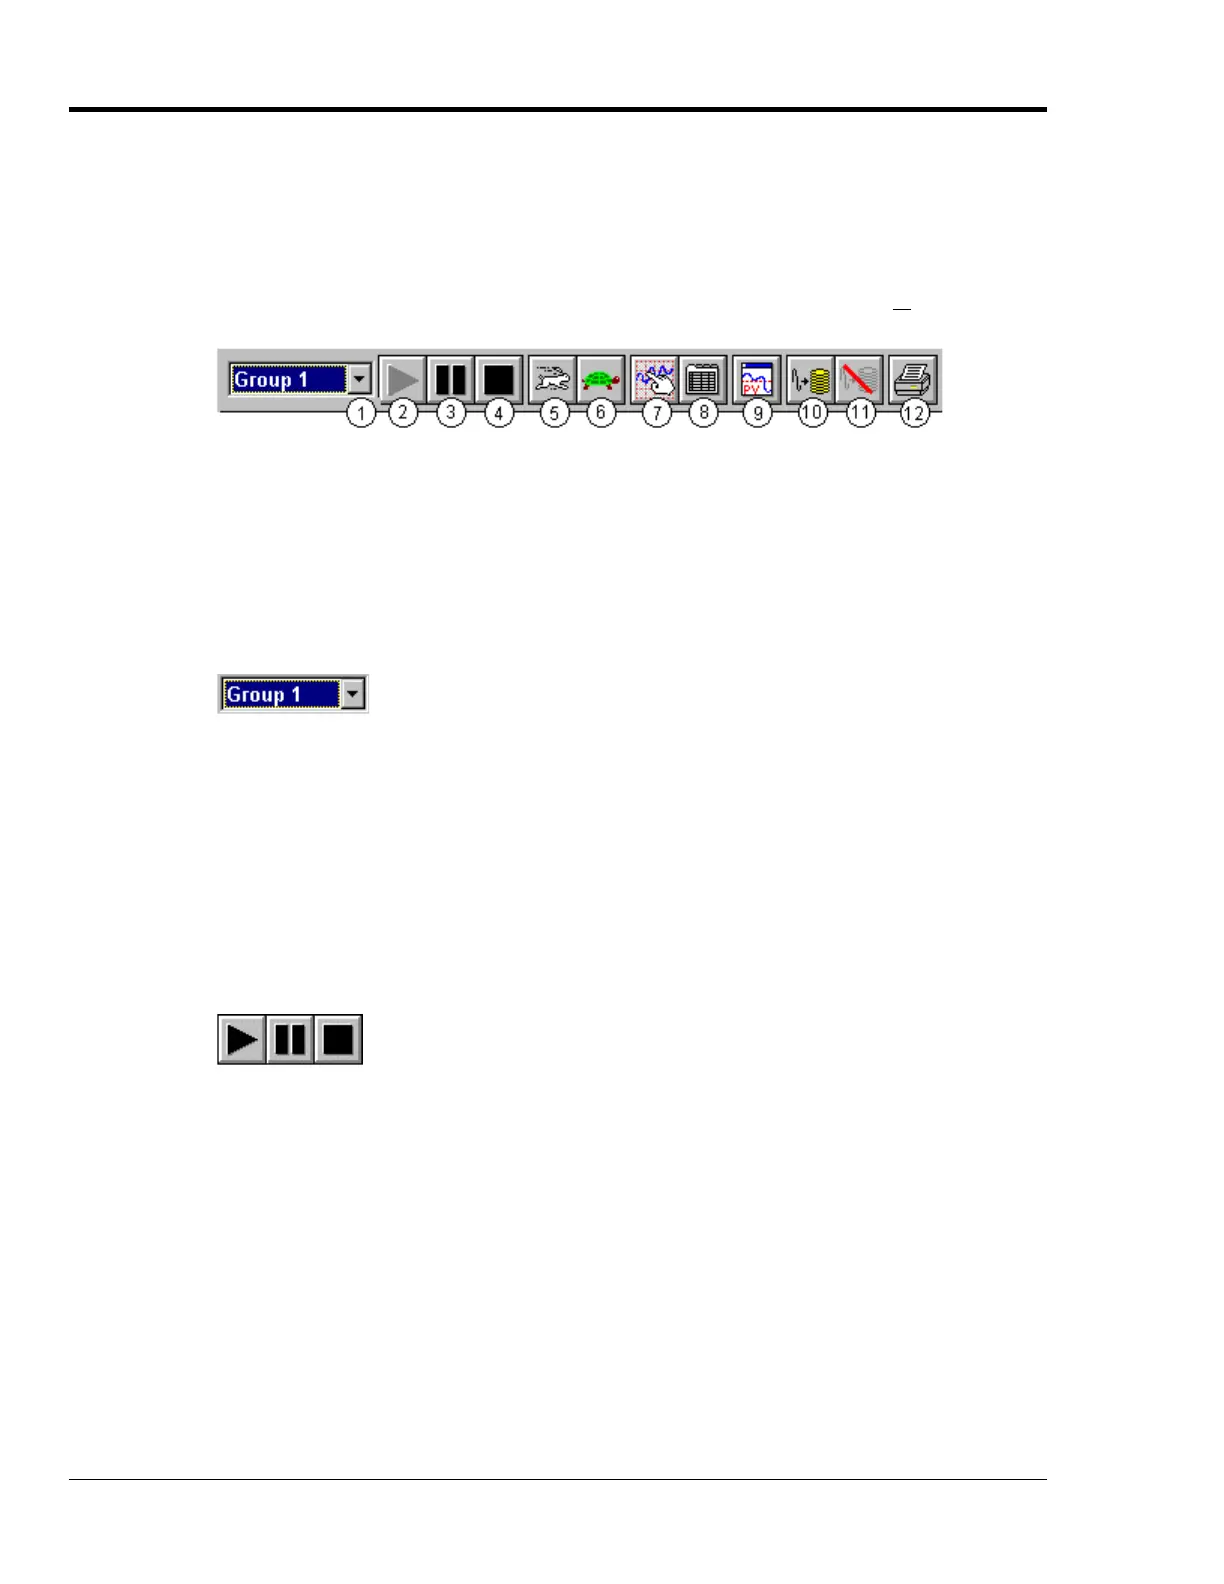
Each item in the toolbar, with exception of Group Select (1), is represented by an individual button
icon and is also accessible from the pull-down menu (discussed later). Placing the cursor on the button
and clicking the mouse button enables the tool, or opens a corresponding dialog box. Each Toolbar
button has a pop-up label that appears when the mouse is placed over the button.
Note: The toolbar represented below is for ChartView’s Main Window. Separate toolbars exist for
Bar Graph, Digital Meters, and Analog Meters options (selectable from the Windows pull-
down menu.) These other toolbars are discussed later in the chapter.
1 Group Select 7 Display Configuration
2 Start Charts and Indicators 8 Channel Configuration
3 Pause Charts 9 PostView post-acq data viewer
4 Stop Charts 10 Arm Acquisition
5 Scroll Faster 11 Disarm …
6 Scroll Slower 12 Print Charts
Group Select
This feature indicates the chart group which is being charted. Clicking on the down arrow (
τ
) reveals
other chart groups configured by the user. The standard ChartView program allows the use of only one
chart group, while ChartView Plus can be configured to display up to 64 groups (one group at a time).
To select a different chart group, simply pull down the group list and select the desired group. The
group list can be obtained by any of the control options provided in the Main Window table. These are:
a) clicking the down arrow (
τ
)), b) using Ctrl + G on the keyboard, c) using the keyboard up or down
arrow key, d) using the page up or page down key. If using a control option other than “a,” you may
need to select the group select box by repeatable pressing the keyboard’s Tab key until the group select
box is selected. When this happens the name of the currently selected group appears in white on a dark
background.
Start, Pause & Stop Charts
As their names imply, these three buttons are used to start, pause, or stop the charts. Pressing “pause”
suspends chart scrolling, but does not stop the “charting” process. While “pause” is pressed, the
channel region of the main window will continue to display real time values. Pressing “pause” a
second time restarts the scrolling action. Pressing “stop” causes the charting process to stop and
instantly freezes the channel region at its present values. This does not affect the acquisition.
 Loading...