3-22 Measurements and Sourcing Voltage Model 6487 Reference Manual
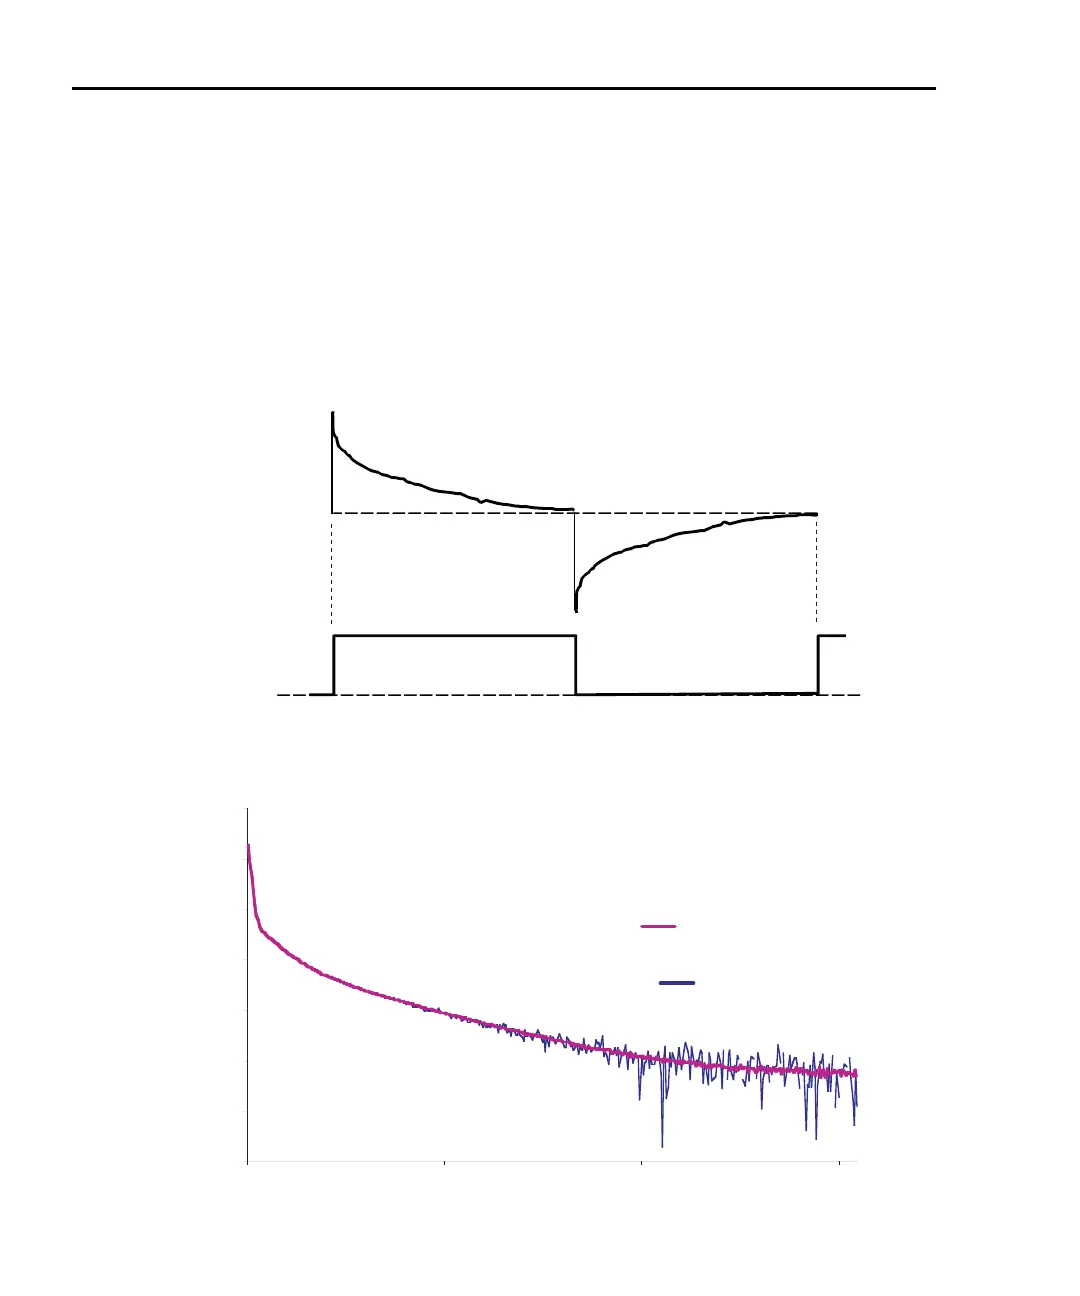
Figure 3-6 shows a comparison of the A-V voltage and the resulting current. When the
voltage first makes a transition from low to high or high to low, the current initially
increases to maximum and then decays to its quiescent value. The decay period, of course,
depends on the RC time constant (τ) of the circuit being tested.
Figure 3-7 demonstrates the clear advantages of A-V ohms. The decaying curve shows
how current decays time without averaging, while the steady-steady current plot at the bot-
tom shows substantially improved results due to averaging of the A-V readings.
Figure 3-6
A-V voltage and current
Figure 3-7
Averaged A-V current
Without
Averaging
Current
(nA)
10
3
Time (s)
05
6
1
15
12
With Averaging
15
9
18
0
 Loading...