5 Using the Data Logger
104 Keysight U1610/20A User’s Guide
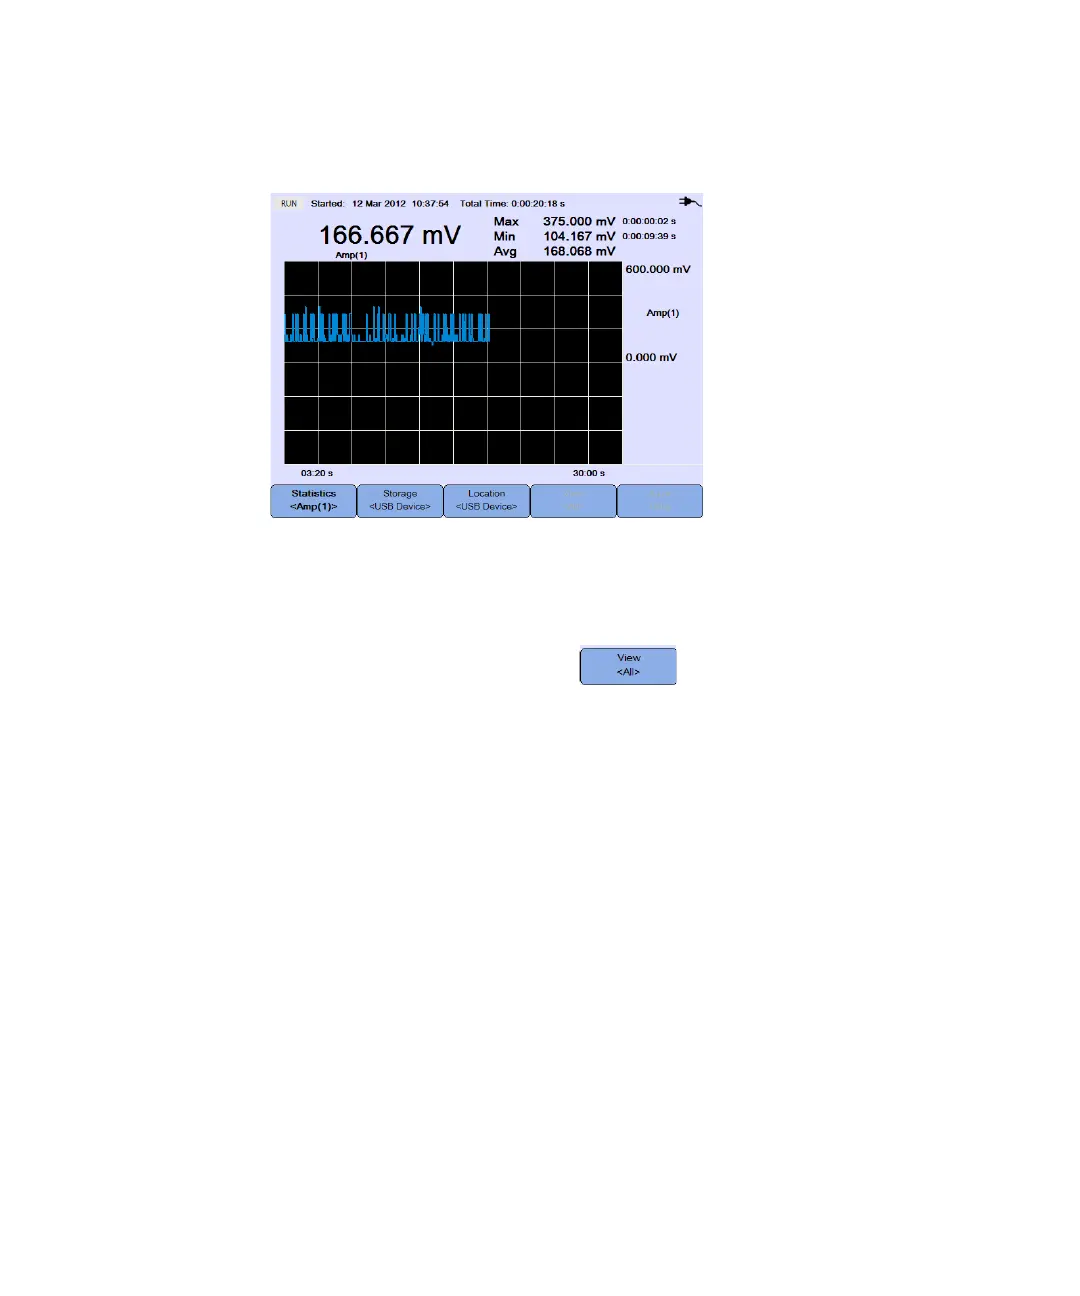
Figure 5-3 Statistics display
Graphing mode
When the logger is stopped, toggle to select the graphing mode.
–View Latest
Only the latest 12 data points are shown. After that, new data is added to the
right and previous data is moved to the left. This gives a clear view of the
recent input.
–View All
Allows you to view all the plotted data since the logger was started/restarted.
All the data is compressed into the grid, allowing you to view long-term trends.