58
Tracking Drifting Signals
Measuring a Source Frequency Drift
Measuring a Source Frequency Drift
The analyzer can measure the short- and long-term stability of a source. The
maximum amplitude level and the frequency drift of an input signal trace can be
displayed and held by using the maximum-hold function. You can also use the
maximum hold function if you want to determine how much of the frequency
spectrum a signal occupies.
This procedure using signal tracking to keep the drifting signal in the center of the
display. The drifting is captured by the analyzer using maximum hold.
Step Action Notes
1 Set up the signal sources. a. Set the frequency of the
signal source to 300 MHz.
b. Set the source amplitude to
−20 dBm
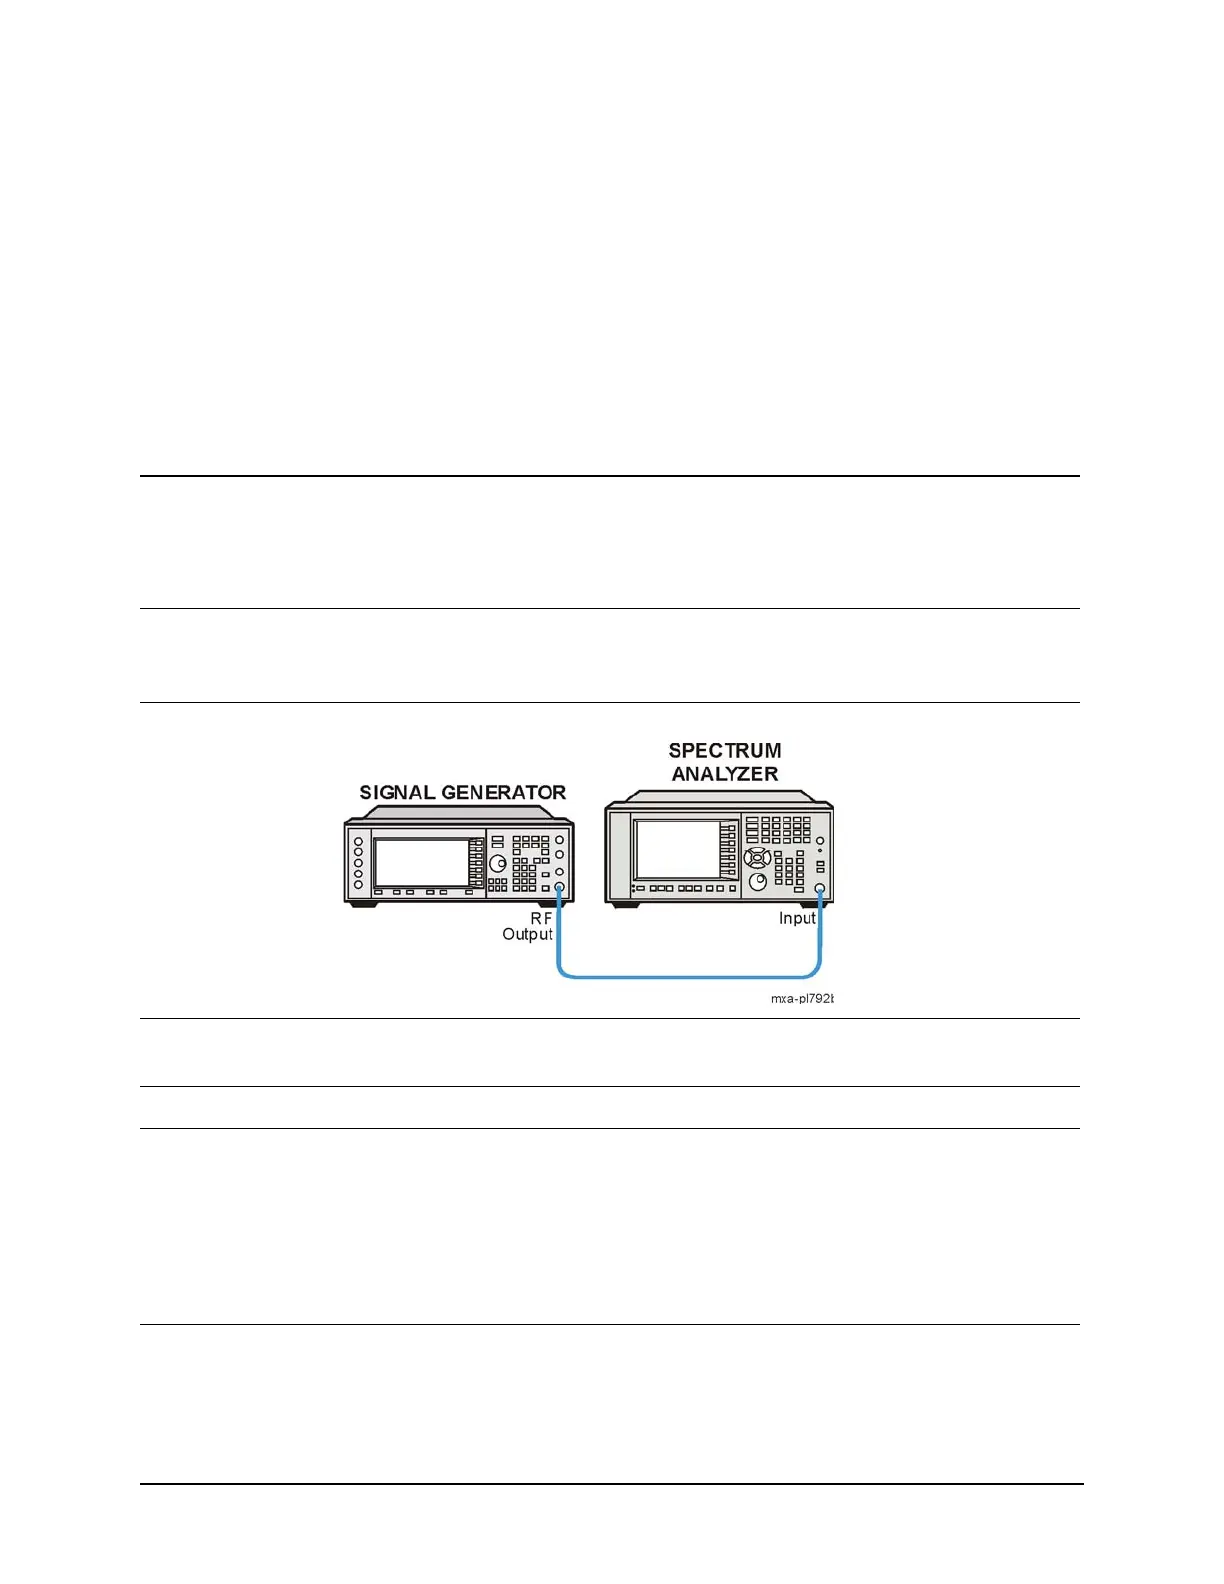
2 Instrument setup. • Connect the source RF
OUTPUT to the analyzer RF
INPUT as shown.
3 Set the analyzer to the
Spectrum Analyzer mode.
• Press Mode, Spectrum
Analyzer.
This enables the spectrum analyzer
measurements.
4 Preset the analyzer • Press Mode Preset.
5 Set the analyzer center
frequency, span and
reference level.
a. Press FREQ Channel,
Center Freq, 300, MHz.
b. .Press SPAN X Scale,
Span, 10, MHz.
c. Press AMPTD Y Scale, Ref
Level, 10, −dBm.
6 Place a marker on the peak
of the signal.
• Press Peak Search.

 Loading...


