Vers. 062721 62
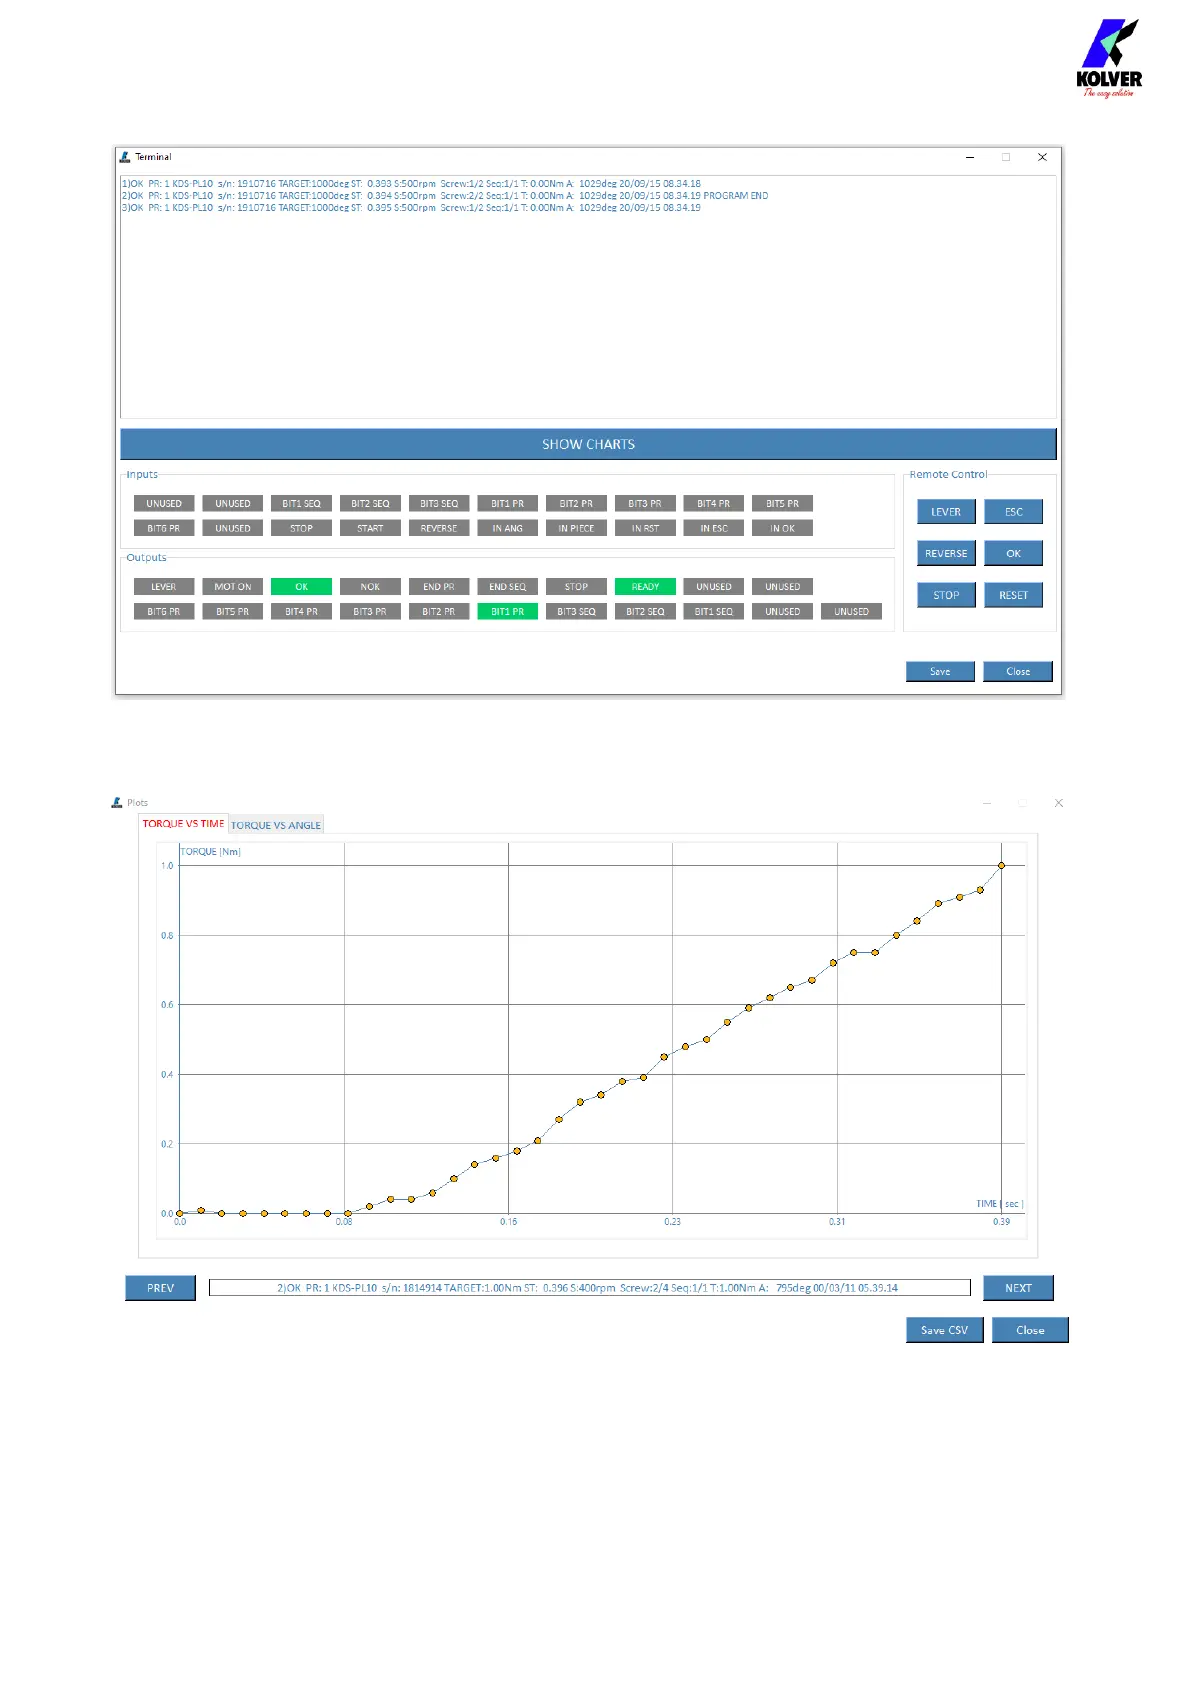
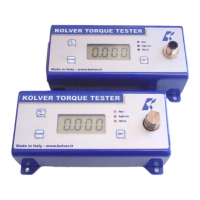
Also, by pressing the SHOW CHARTS bar, you can view the torque-time and torque-angle
graphs.
The graphs show the values sampled during the screwing corresponding to the print string
shown below them. Pressing on one of them with the mouse it is possible to visualize the x
and y axis values. Also note that it is possible to move between the graphs of each rundown
by pressing the right and left directional arrows.