14 cHAPTER 2: Background
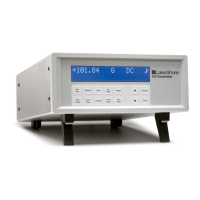
Model 425 Gaussmeter
2.4.2 Temperature
Coefficients
There are two technically different temperature coefficients that always affect a
gaussmeter probe: the temperature coefficient of zero and the temperature coef-
fecient of sensitivity (section 2.4.2.1 and section 2.4.2.2). Under normal usage (read-
ing a magnetic field), it is virtually impossible to separate the effect of each.
The Model 425 gaussmeter does not possess circuitry to allow compensation for
these temperature errors. Thus, a user operating a probe in a variable temperature
environment must be aware that both errors exist and what the maximum effect
could be. The temperature coefficients are repeatable for an individual probe. A user
can pre-measure the changes and manually correct the data for zero and sensitivity
effects, or the combination of both at specific magnetic field values. The Model 425
gaussmeter also has its own temperature coefficients, which are typically less than
probe coefficients. These are listed in section 1.6.
2.4.2.1 The Temperature Coefficient of Zero
The temperature coefficient of zero is a change in the zero field offset with tempera-
ture. This change is always present whether or not a field is measured. However, the
temperature error caused by zero change is often the dominant source of error at
magnetic field levels <100 G. If you have the ability to zero the gaussmeter at operat-
ing temperature, this coefficient is nullified and has no effect on accuracy. If the
gaussmeter cannot be zeroed, then the zero change effect is present.
The unit of measure is G/° C. It is generally a fixed number, and can be either a positive
or negative value. This error is specific to each probe and can be a fixed magnitude
anywhere from the negative maximum to positive maximum value.
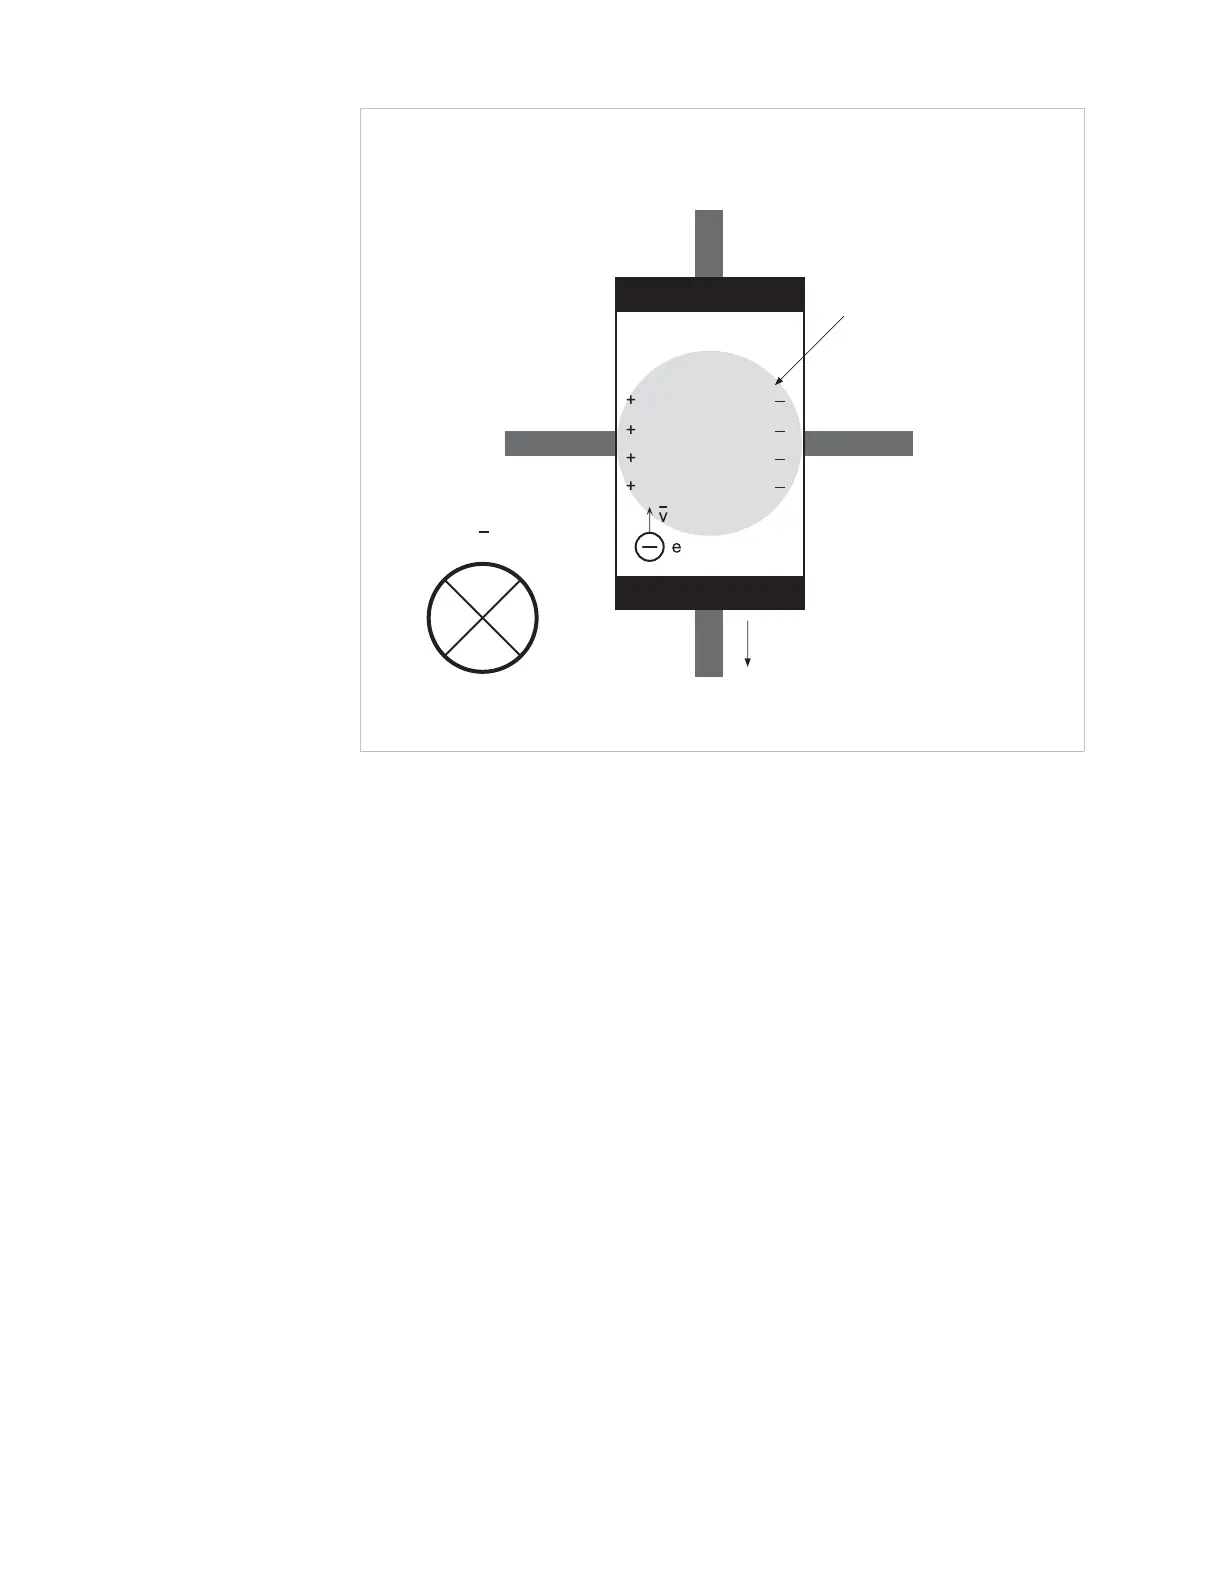
FIGURE 2-2 Approximate active area
VH (+) VH (–)
Approximate
active area
B
I
C
(+)
I
C
(–)