3-14 System 824 Training Manual 2/19/98
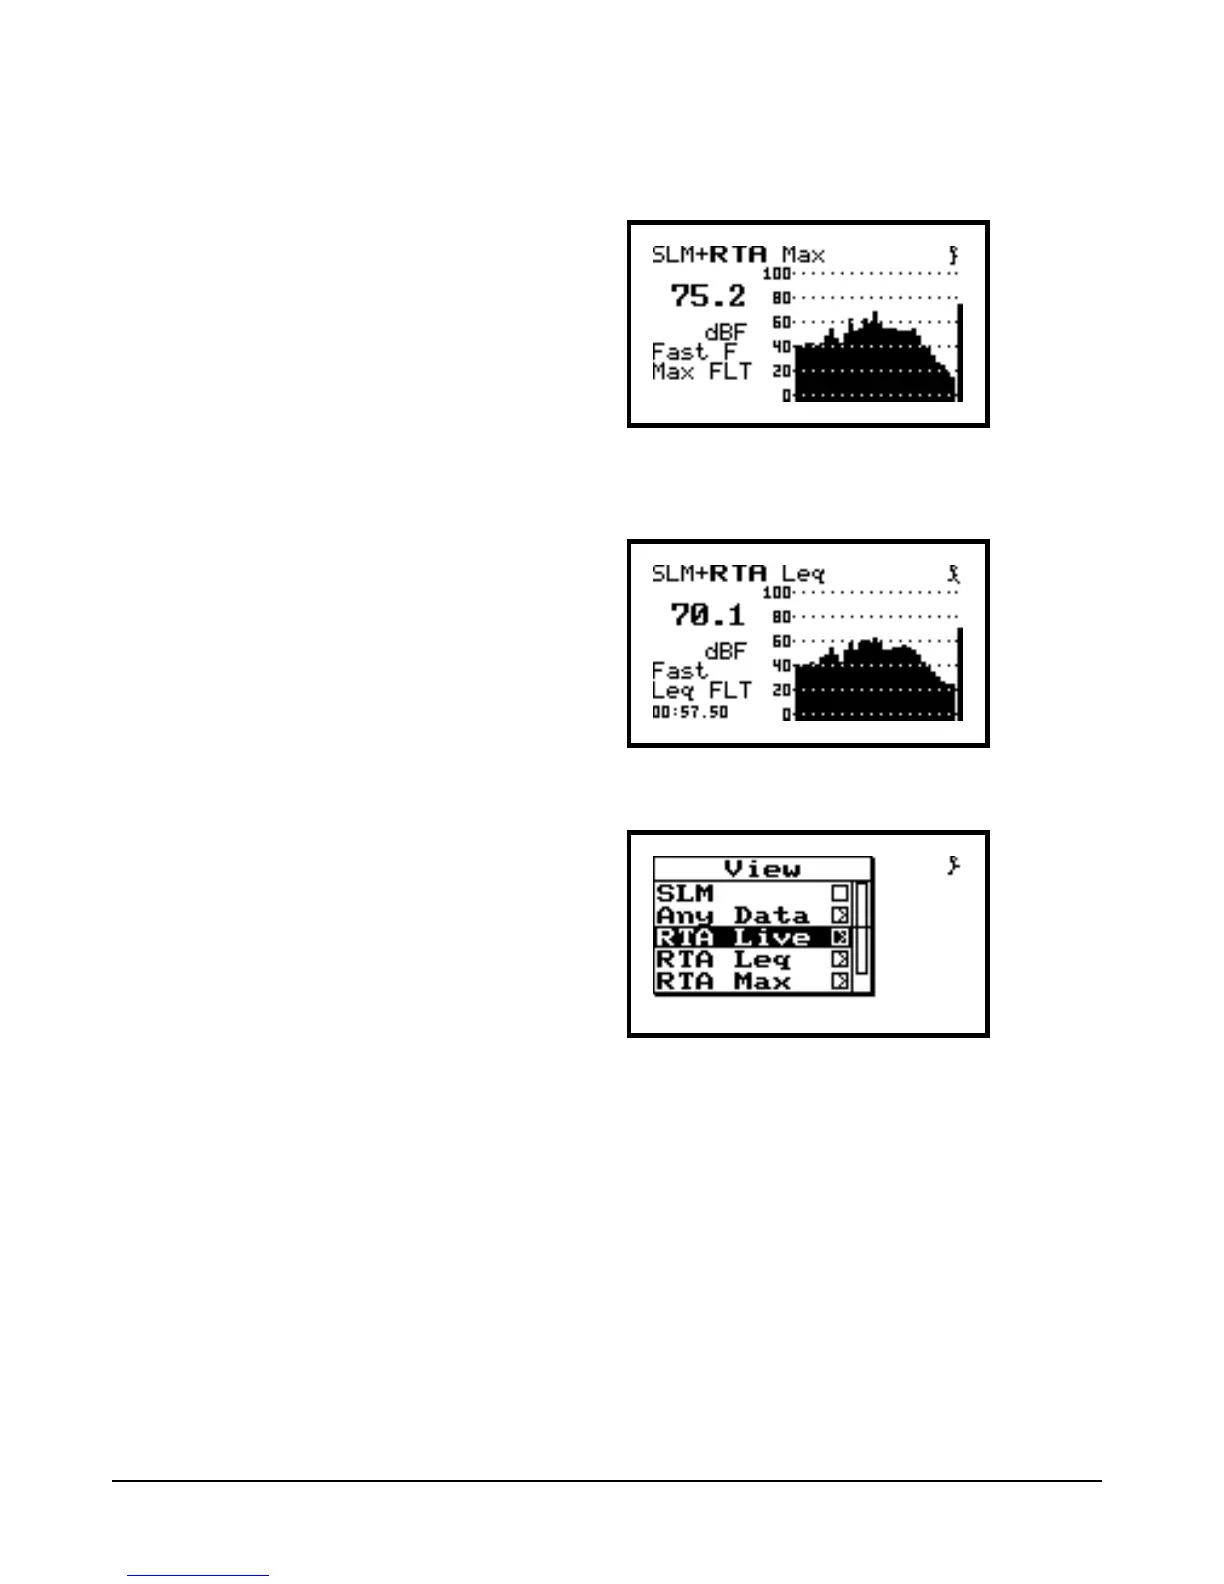
The screen contains a graphic of the
Max spectrum. This is the spectrum
that occurred that contains the larg-
est amount of energy during the cur-
rent run time. r and l are used
to move the cursor to the various fre-
quency bands.
Step 20 Press u to access the “SLM+RTA Max”
screen.
Here the screen shows a graphic of
the Leq spectrum. r and l once
again are used to move the cursor to
the different frequency bands of the
spectrum.
Step 21 Press u to access the “SLM+RTA Leq”
screen.
Notice the next two choices in the
View menu are “RTA Leq” and
“RTA Max”. We have just viewed
these displays. They can also be
accessed here from the View menu.
Step 22 Press VIEW V to return to the View menu.
We are finished with the Simple Sound Analyzer
(SSA). We have seen the data that we can view in this
mode, and have learned how to change the different
setup and display options. Before exploring the other
types of setups that you may have in your particular
824, lets explore the other common features with all
824’s.
Step 23 Press V to exit back to the SLM+RTA screen.
 Loading...


