LEGOeducation.com
Data Logging
To log data is to collect information for analysis. For example,
aweatherperson might collect temperature readings throughout
theday, and then analyse these for a report on the evening news.
Or azookeeper might collect data on where visitors are spending
their time at the zoo. The EV3 Software cannot only record data, it
can help you to organize and analyse it.
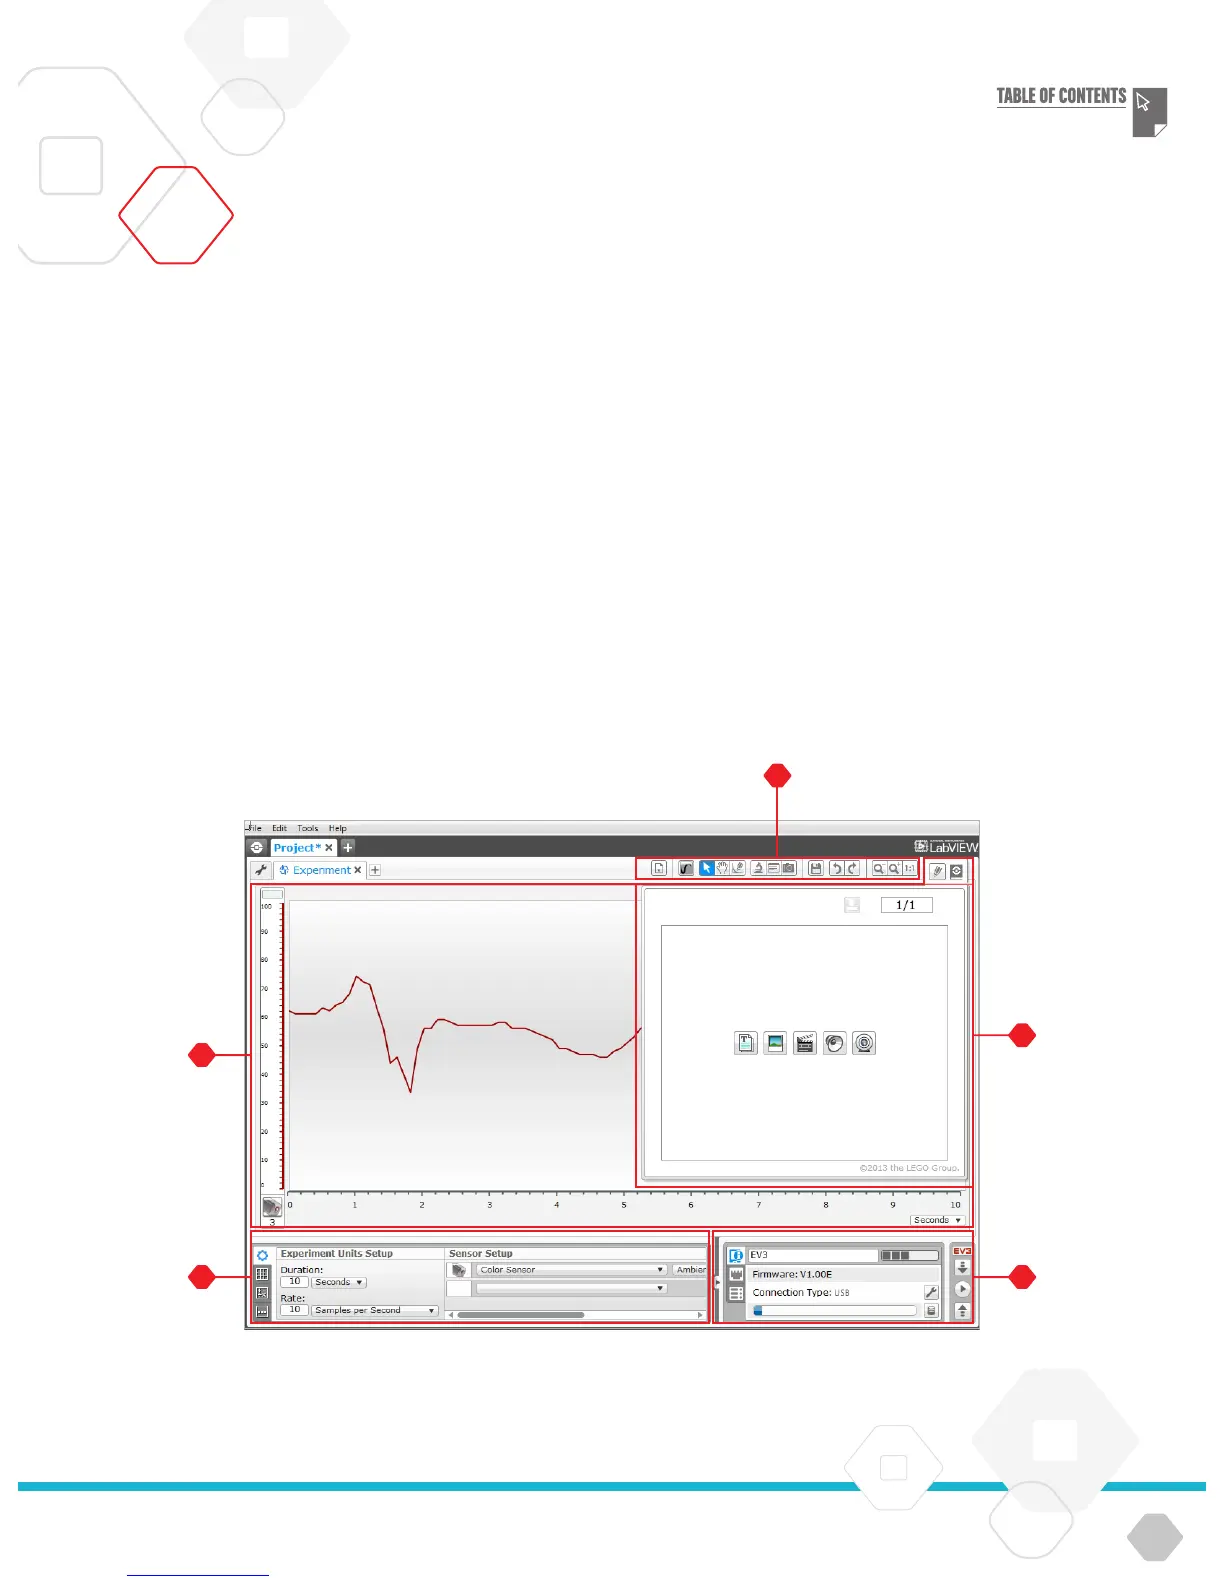
The EV3 Data Logging environment consists of the following
main areas:
Graph Area – This is where you see and analyse your data plots.
Configuration Panel – Here you set up your experiment,
manage your dataset, and get access to Dataset Calculation
and Graph Programming, special data logging functionalities.
Hardware Page – Establish and manage your communication
with the EV3 Brick here and see what sensors are connected
where. This is also where you download experiments to the
EV3 Brick and upload data to the software.
Content Editor – A digital workbook integrated into the
software. Get instructions or document your project using text,
images, and videos.
Data Logging Toolbar – Find basic tools for working with your
graph and experiment here. Learn more about these tools in
the EV3 Software Help.
Data Logging environment
EV3 SOFTWARE