WSDA
®
-2000 User Manual
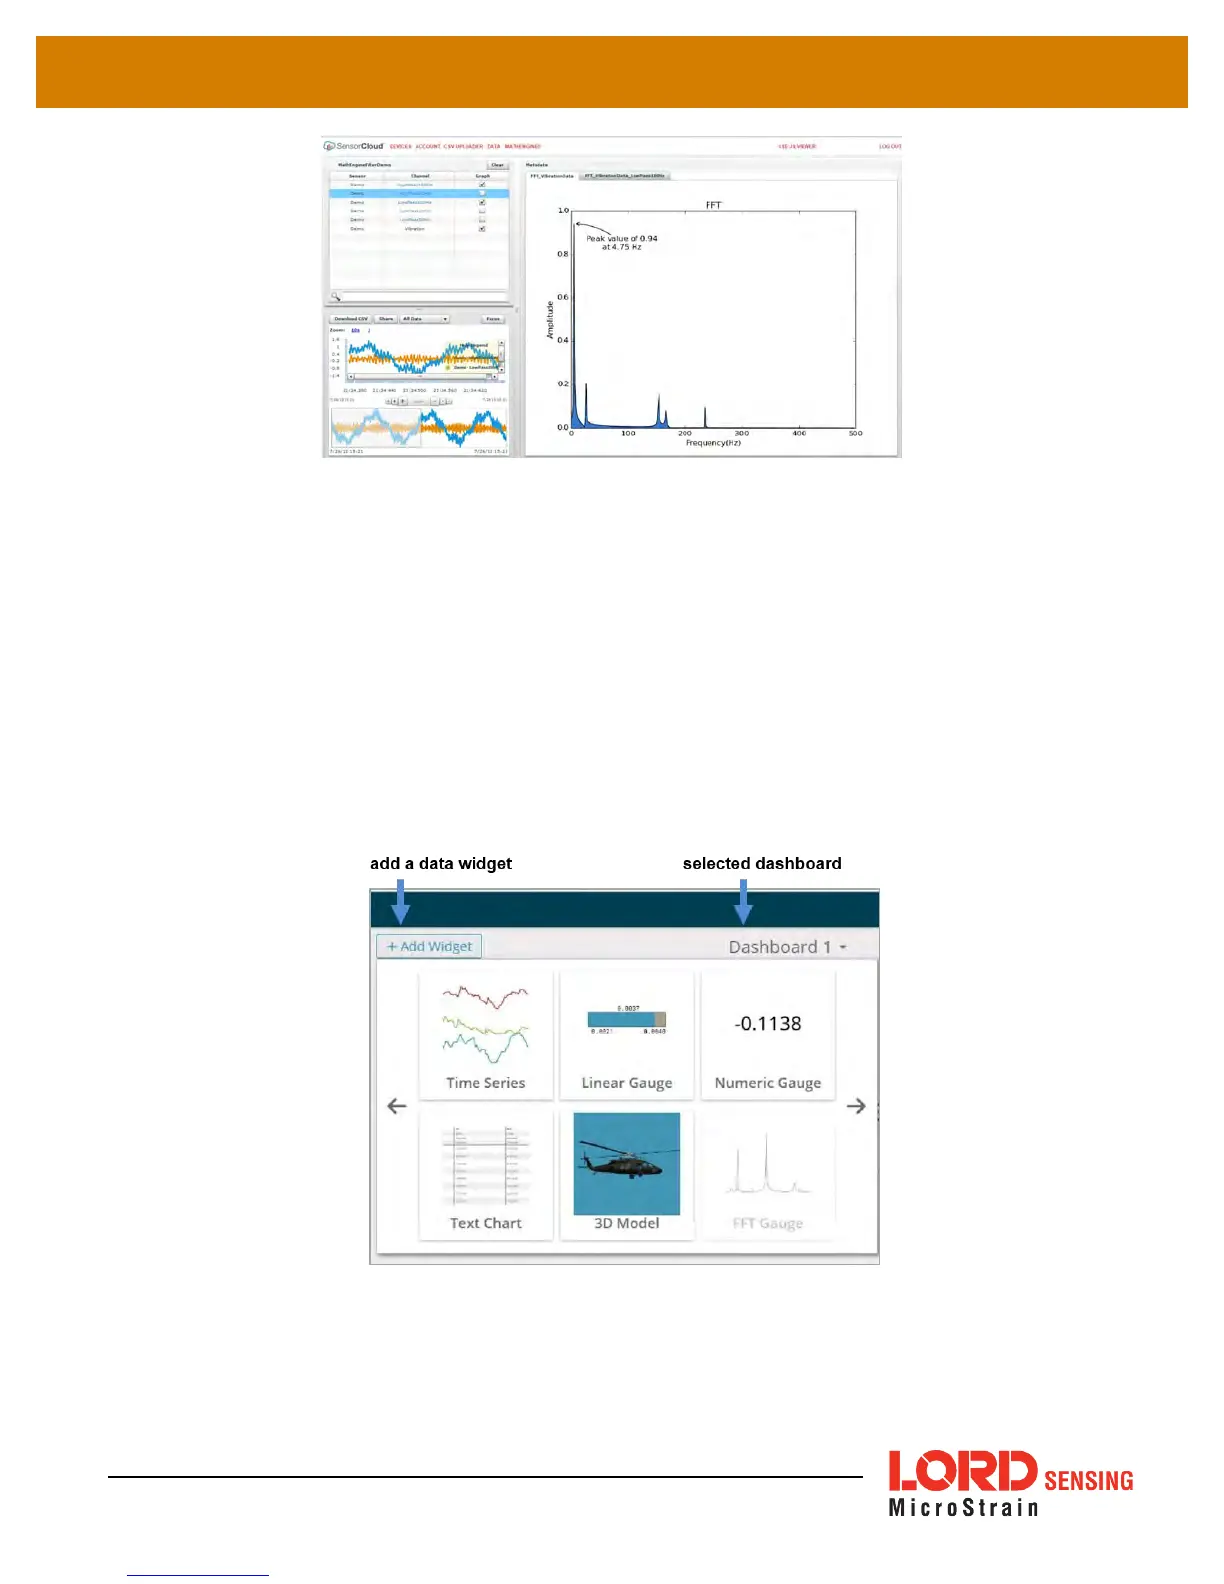
Figure 43 - FFT Graph in SensorCloud
8.2 SensorConnect
8.2.1 Using Dashboards and Widgets
Collected data is viewed on the Data page through the creation of dashboards and widgets. Think
of dashboards as individual pages and widgets as an illustration on the page. Create multiple data
widgets on each dashboard to display sampled data as a time-series graph, text chart, or a simple
gauge that only displays the most current reading. This format provides an easy way to organize
many sensors and networks, and it allows the information to be displayed in the most appropriate
layout.
Figure 44 - Viewing Data
61