31
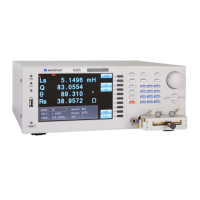
The figure below is the screen when the compare function is enabled; the bars under the various
Set of measured values will change according to the values.
Figure 3-3-6 Measurement Screen When Compare Function is ON
The bar graph of the compare function is displayed as follows:
LO : When the measured value is lower than the lower limit, the bar will be displayed in red, and
fall within the “LO” range.
PASS : When the measured value is within the upper and lower limits, the bar will be displayed in
green, and fall within the “PASS” range.
HI : When the measured value is lower than the lower limit, the bar will be displayed in red, and
fall within the “HI” range.
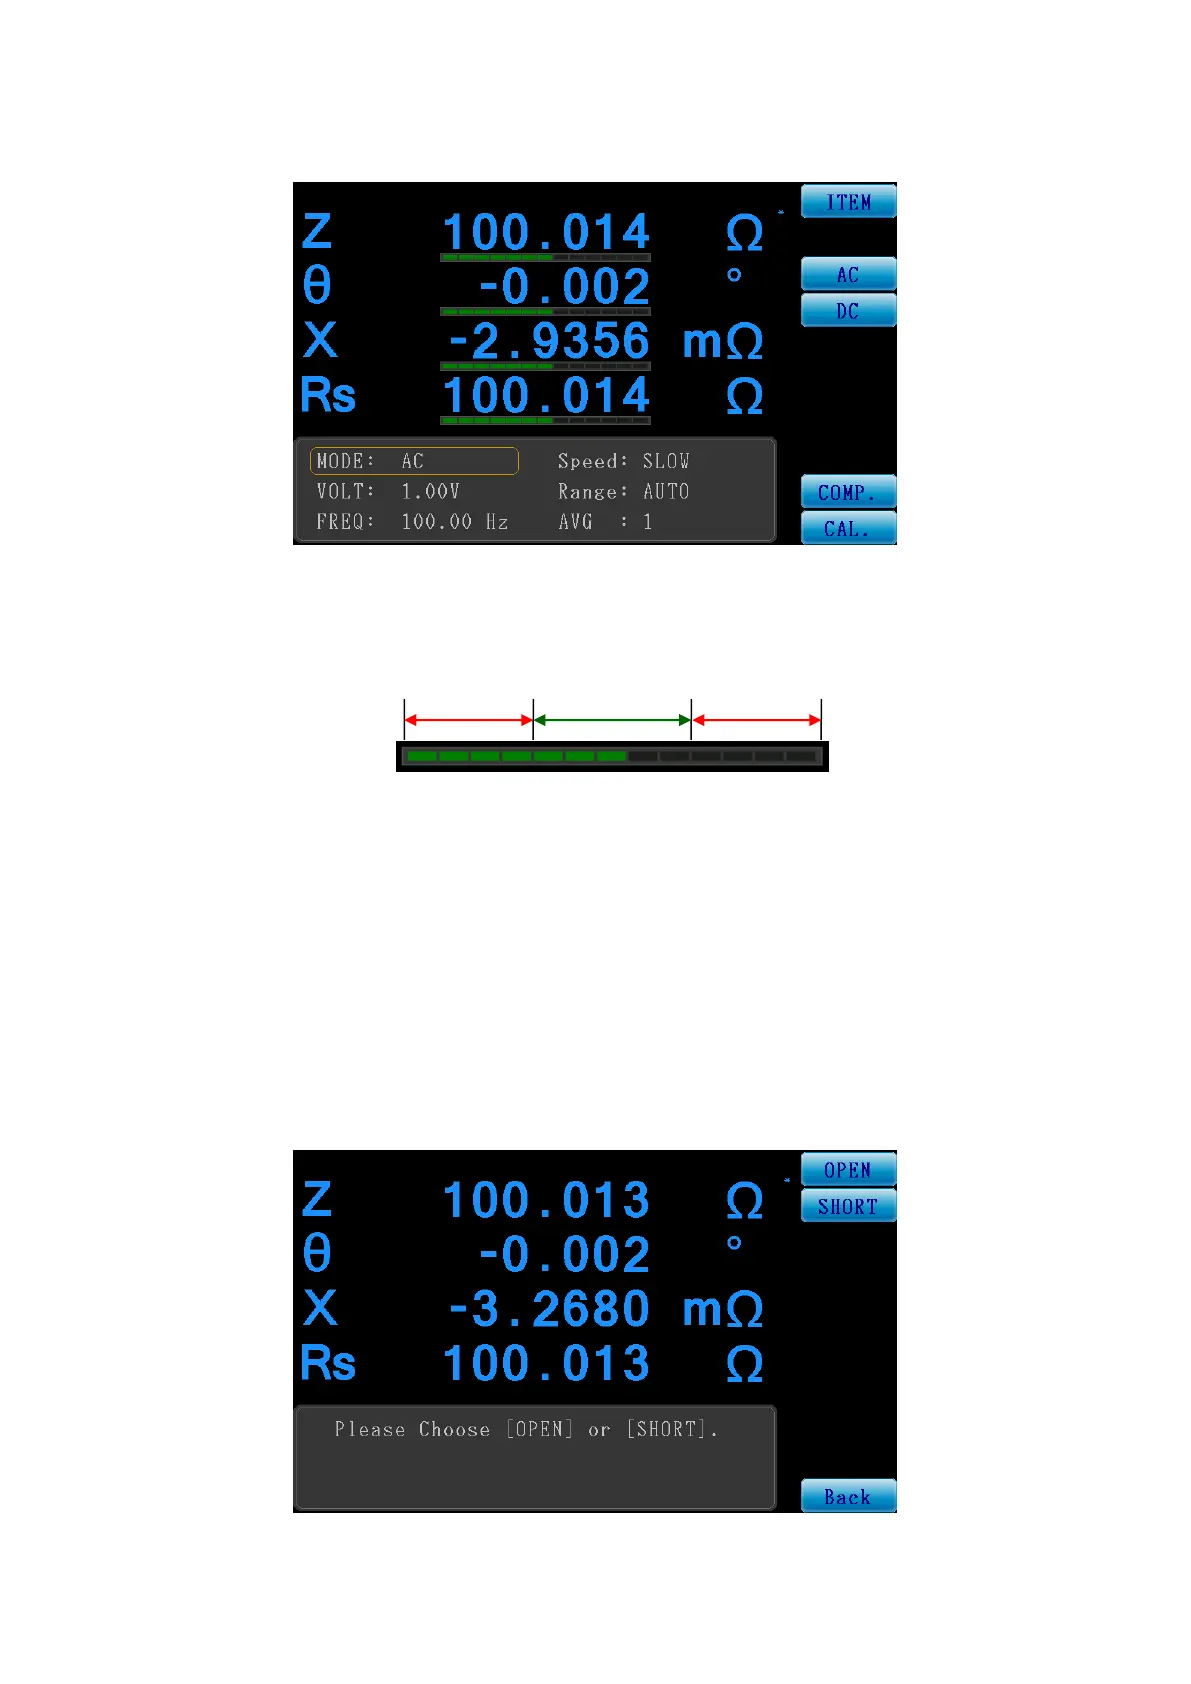
CAL.:
The calibration function provides OPEN/SHORT calibration.
Figure 3-3-7 Meter Mode Calibration Function Screen