Classic Manual Rev L
47 | P a g e 1 0 - 0 0 1 - 1 R E V L
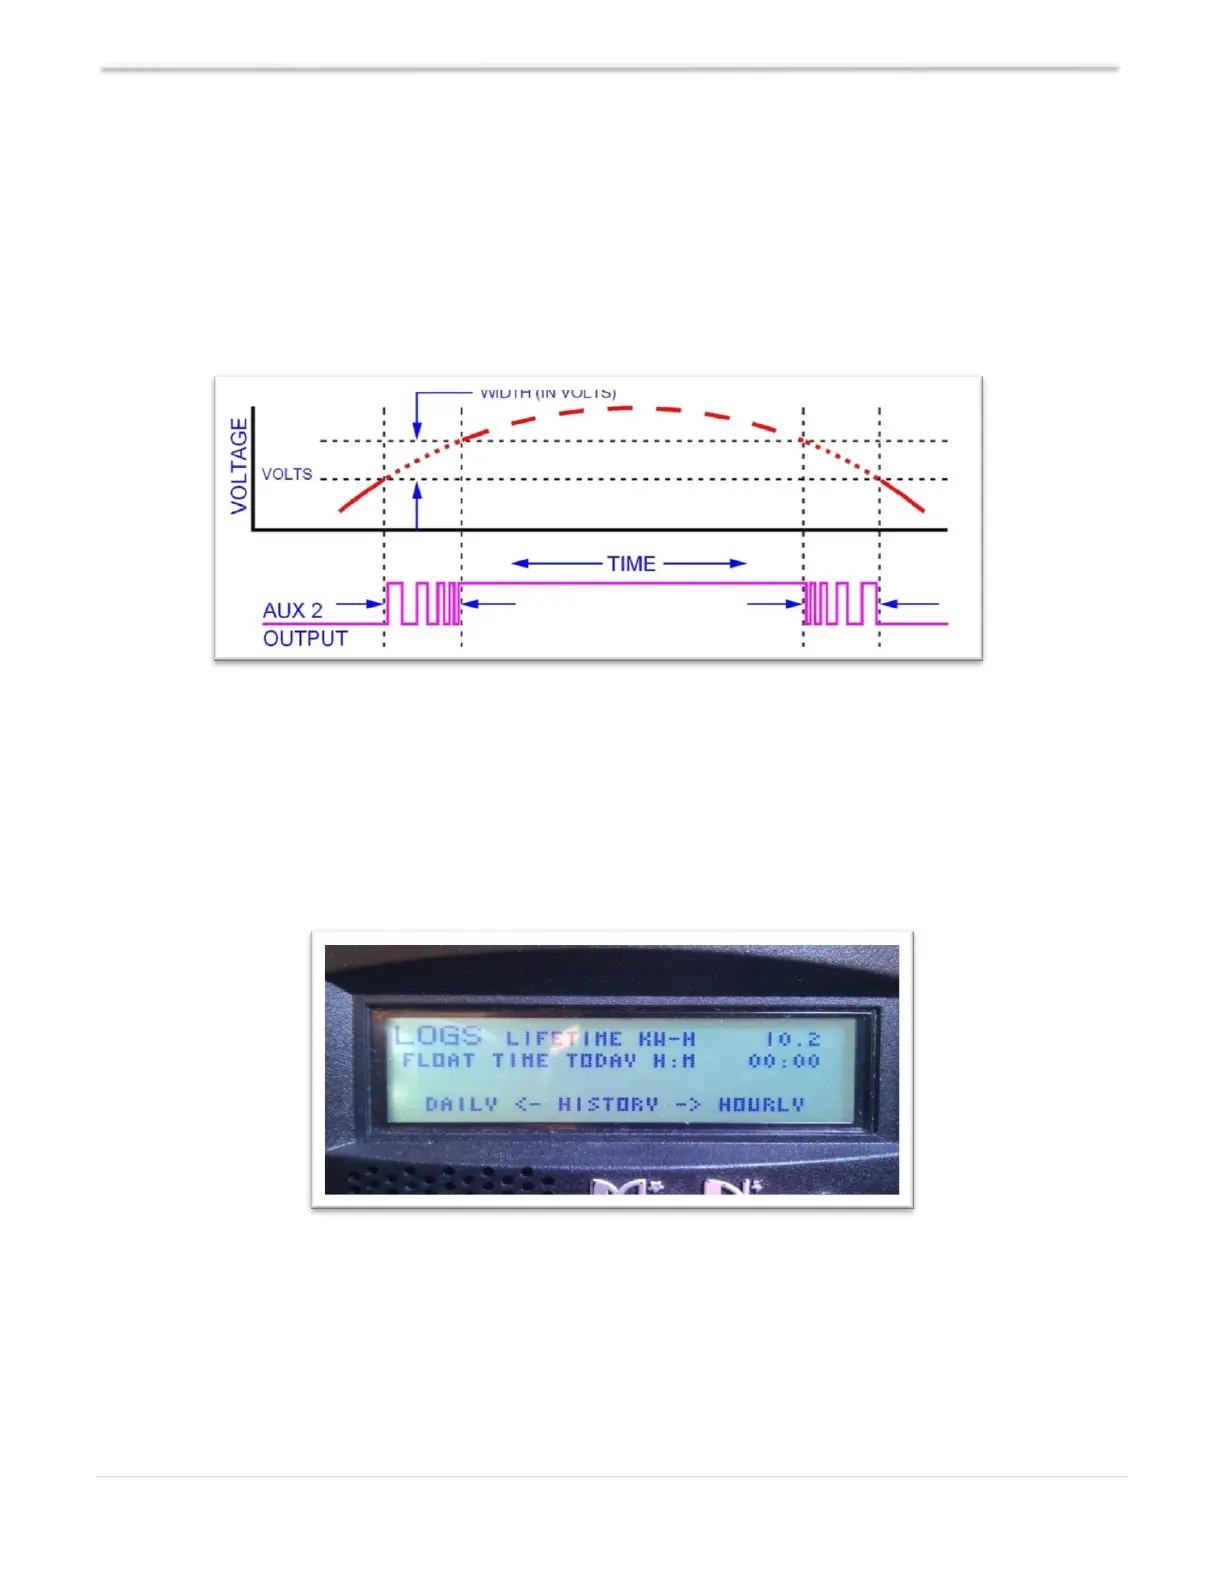
AUX 2 Volts/Time Graph
Diagram 9 is the AUX 2 Function Graph showing the relationship between voltage and time. The
difference in AUX 2 is the use of PWM running at a 500Hz rate and is suitable for use with Solid State
Relays (SSRs). How it works: user sets a desired threshold and a width voltage; this means that at
the desired voltage (VOLTS), AUX 2 will start to PWM and it has to go above or below the width to
completely change states (from 0V to 12V, or from 12V to 0V depending on the user selection). This
gives a much smoother transition.
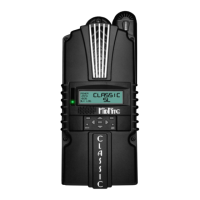
Logged Data
The Classic logs 380 days of data in its memory. The data logging in the Classic has two modes and
frequency of data capture: Daily and Hourly.
Figure 22
Daily History
Is captured once each day and is saved at night, after 2 hours of no activity when the PV input
voltage is below battery voltage for solar, or in modes that do not necessarily rest at night,
like wind or hydro, the capture will happen once every 24 hours. Data logged each day is
kilowatt-hours, Float time in hours and minutes, the maximum power output for the day,
Diagram 9 – AUX 2 Function Graph