Moxa Managed Ethernet Switch (UI_2.0_FW_5.x) User Manual
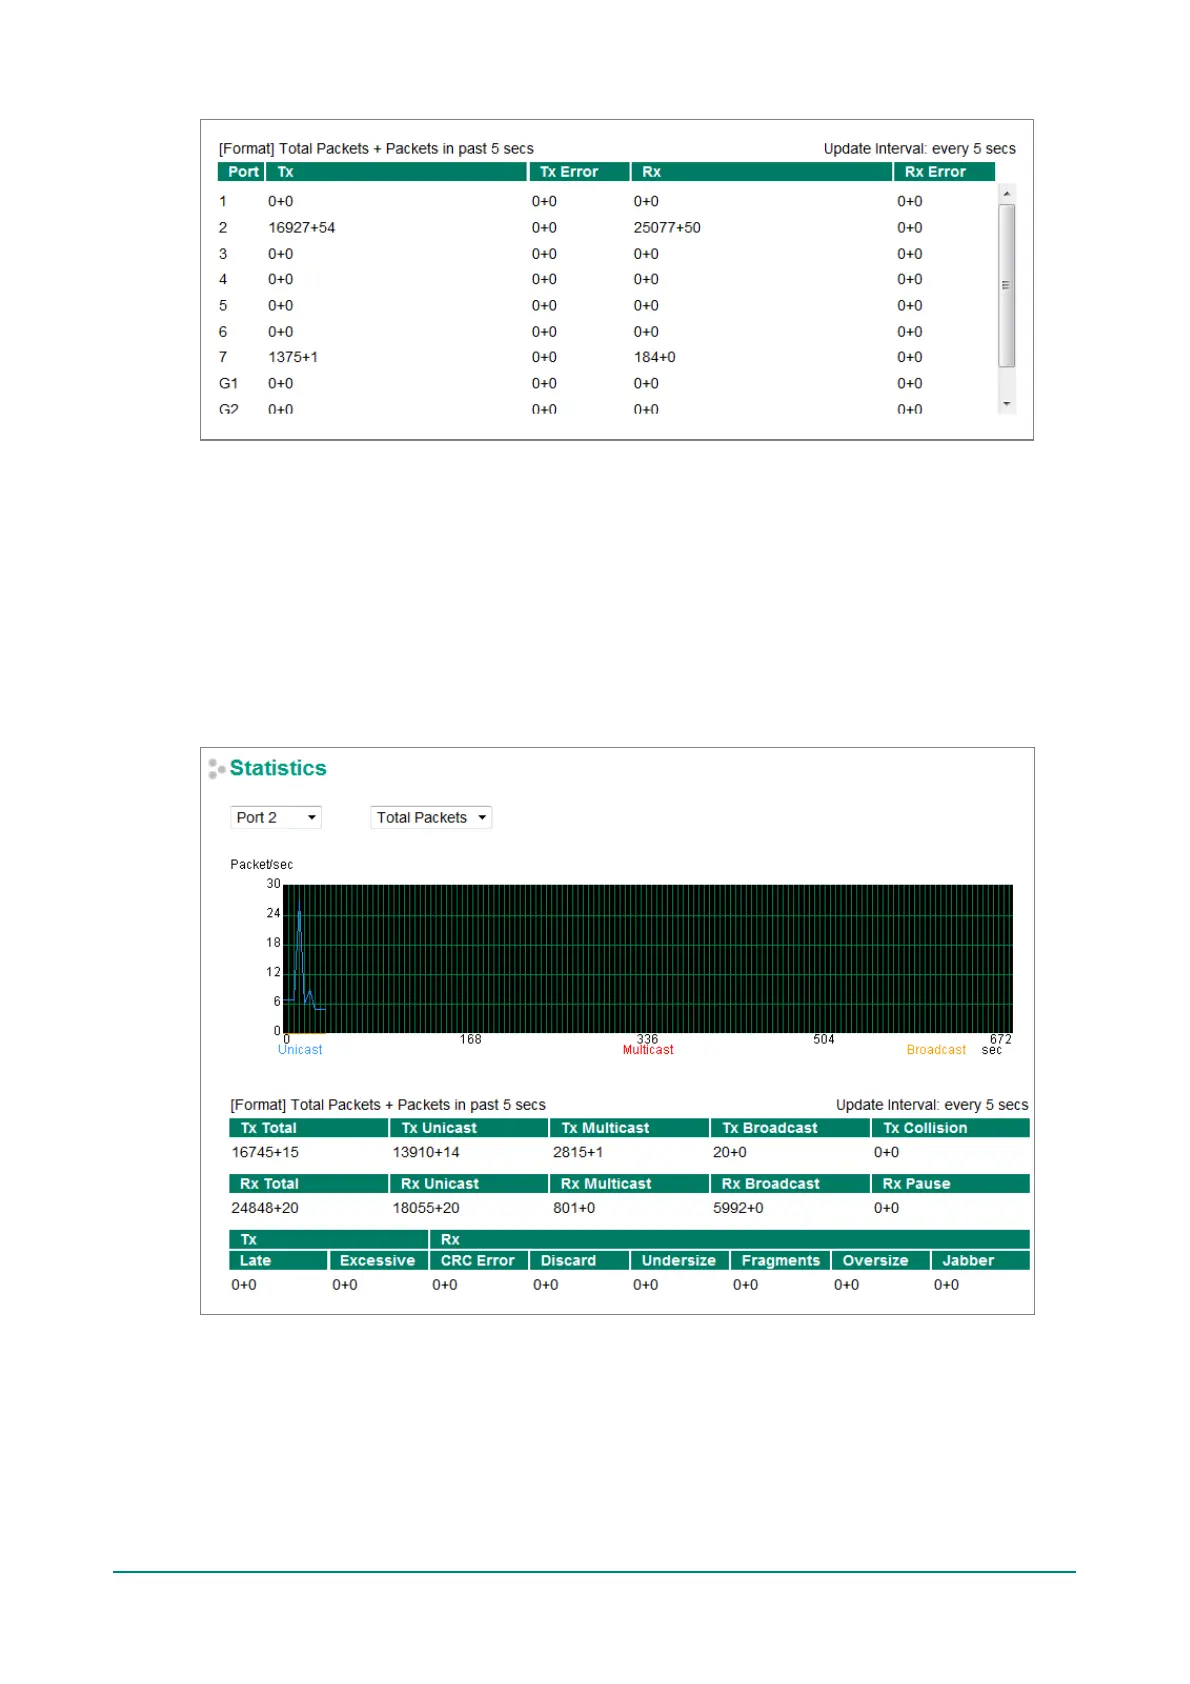
Monitor by Port
Access the Monitor by Port function by selecting FE or GE Ports or Port i, in which i = 1, 2, …, G2, from
the lef t pull-down list. The Port i options are identical to the Monitor by System function discussed above, in
that users can view graphs that show All Packets, TX Packets, RX Packets, or Error Packets activity, but in
this case, only f or an individual port. The All Ports option is essentially a graphical display of the individual
port activity that can be viewed with the Console Monitor f unction discussed above. The All Ports option
shows three vertical bars for each port. The height of the bar represents Packets/s for the type of packet,
at the instant the bar is being viewed. That is, as time progresses, the height of the bar moves up or down
so that the user can view the change in the rate of packet transmission. The blue colored bar shows Uni-
cast packets, the red colored bar shows Multi-cast packets, and the orange colored bar shows Broad-cast
packets. The graph is updated every few seconds, allowing the user to analyze data transmission activity in
real-time.
 Loading...