Moxa Managed Ethernet Switch (UI_2.0_FW_5.x) User Manual
CPU Utilization
Read-only
The CPU usage volume in the past 5 seconds, 30 seconds, and
5 minutes. When the system is using less than 50% of CPU
usage, the f irst green bar will f ill up. When the CPU usage is
between 51% and 75%, the green and yellow bars will be
filled. When it exceeds 75%, the system will be considered
busy and all green, yellow, and red bars will be f illed.
Past 5 secs
Free Memory
The switch’s current free memory
Power Consumption
Read-only
The current system power consumption inf ormation. The
measurement tolerance is 7% (Unit: watts.)
None
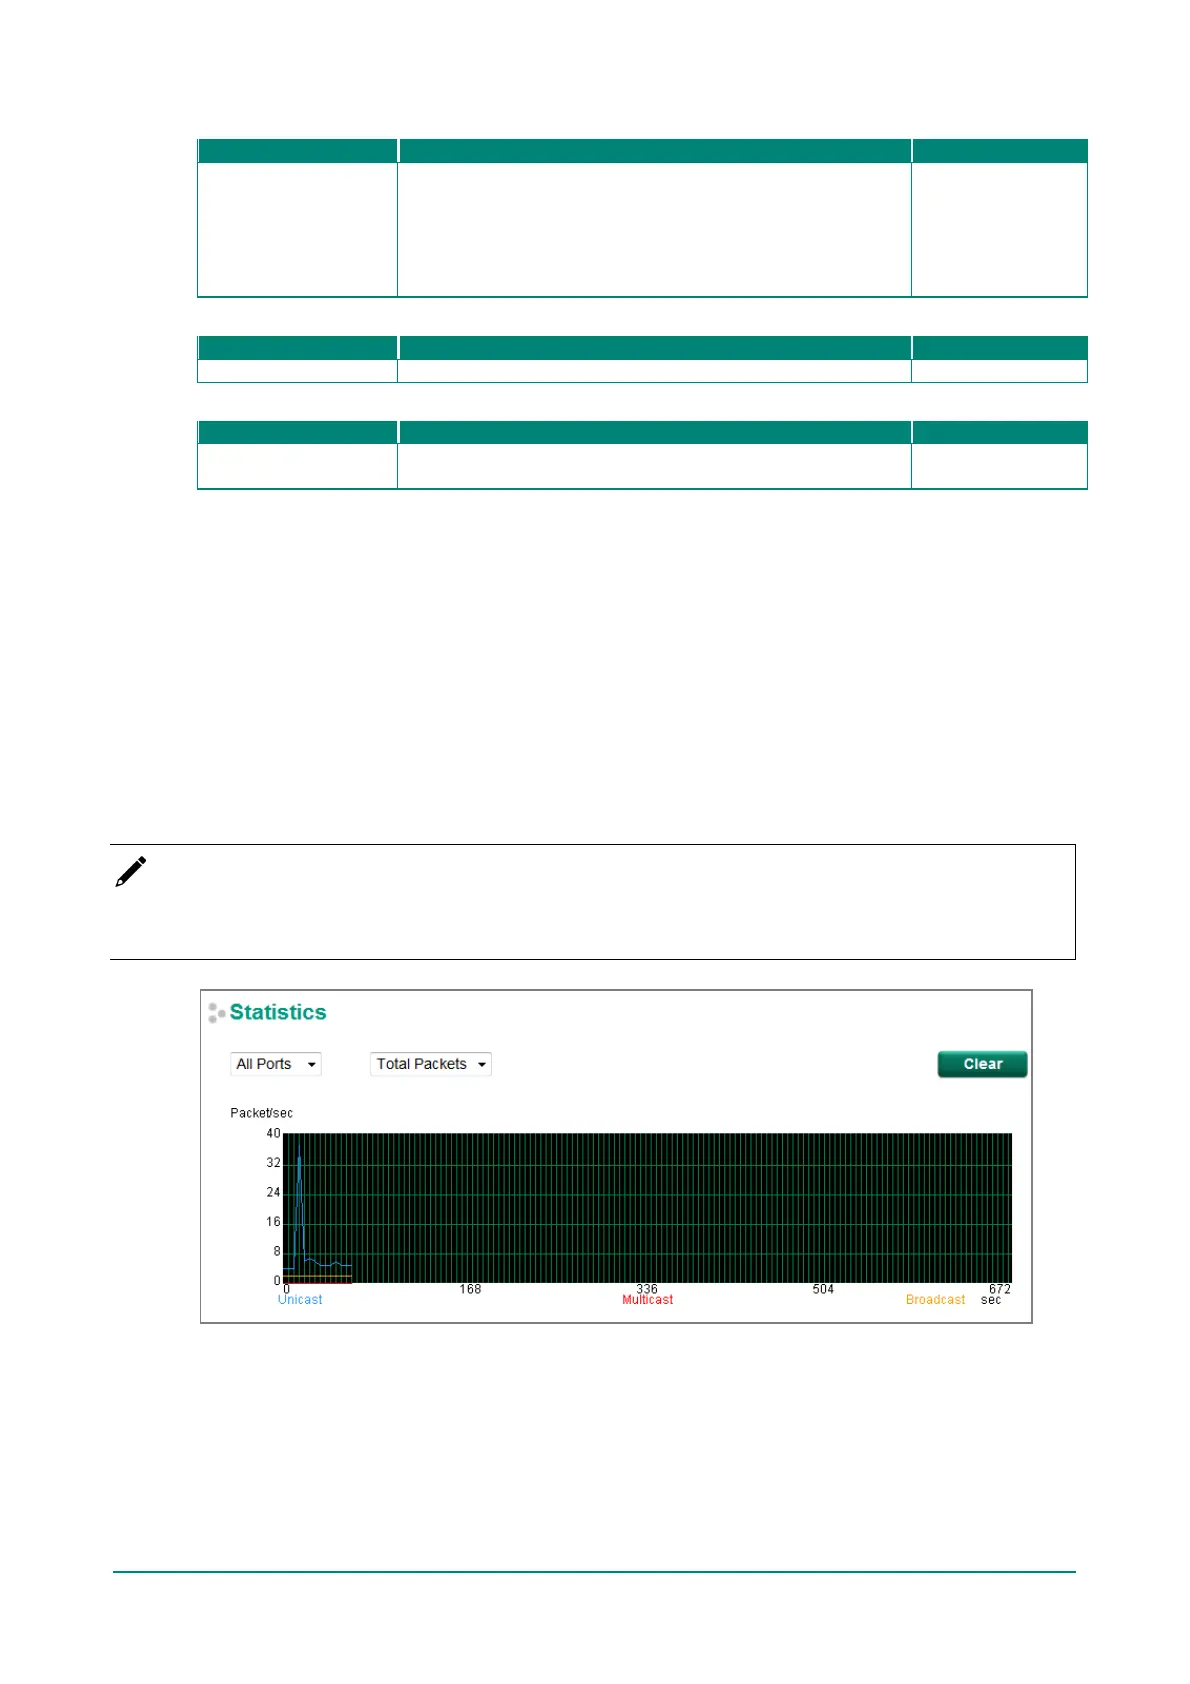
Statistics
Access the Monitor by selecting Monitoring from the left selection bar. Monitor by System allows the user
to view a graph that shows the combined data transmission activity of all of the Moxa switch’s 18 ports.
Click one of the f our options—Total Packets, TX Packets, RX Packets, or Error Packets—to view
transmission activity of specific types of packets. Recall that TX Packets are packets sent out from the Moxa
switch, RX Packets are packets received from connected devices, and Error Packets are packets that did not
pass TCP/IP’s error checking algorithm. The Total Packets option displays a graph that combines TX, RX,
and TX Error, RX Error Packet activity. The graph displays data transmission activity by showing Packets/s
(i.e., packets per second, or pps) versus sec. (seconds). In fact, three curves are displayed on the same
graph: Uni-cast packets (in red color), Multi-cast packets (in green color), and Broad-cast packets (in
blue color). The graph is updated every f ew seconds, allowing the user to analyze data transmission activity
in real-time.
NOTE
All the statistics are extracted f rom main chip’s registers sequentially. Therefore, for a few time stamps the
total packet count may not align accurately (e.g. Total ≠ sum of Tx + Rx).
 Loading...