8 Operating modes
82 FieldMan Narda
The display in detail
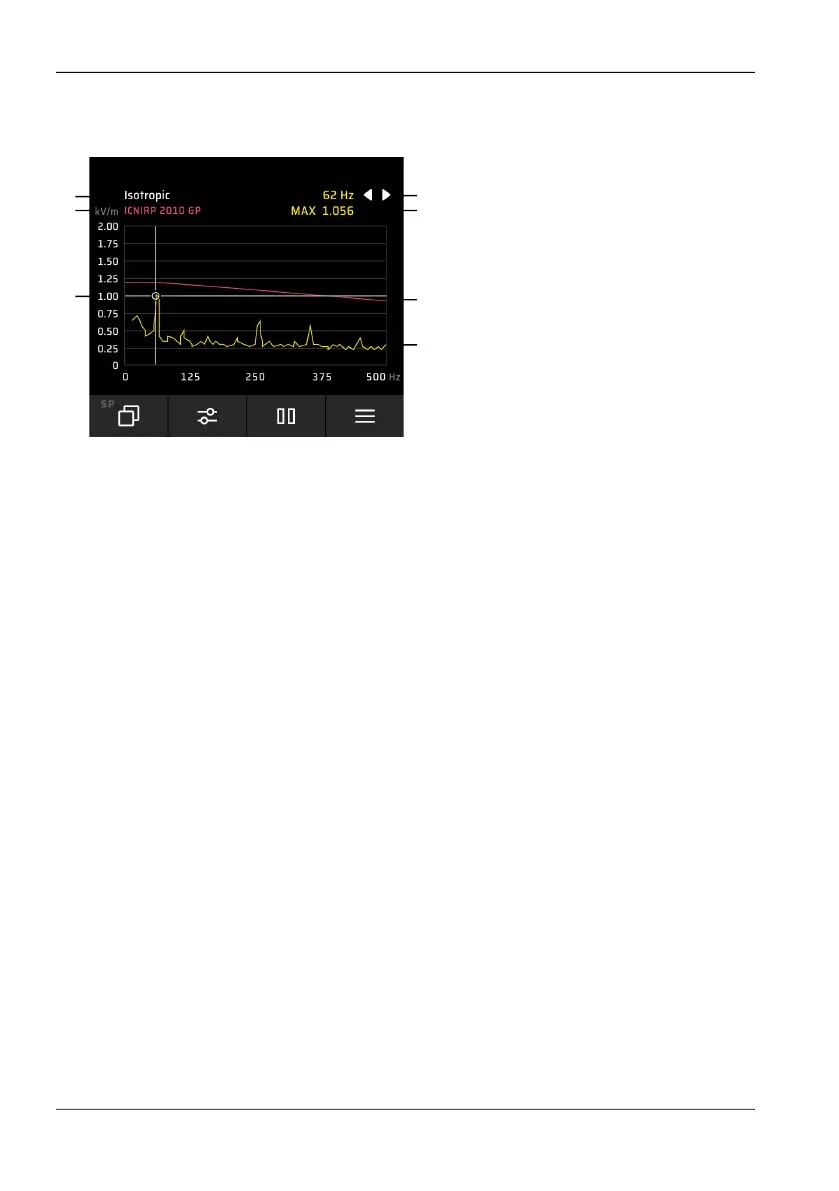
Fig. 12: Graphical display of the spectrum
1 Type of measuring curve (X, Y, Z-axis or isotropic)
2 Selected standard
3 Marker position
4 Marker functions (see Using the marker on page 82)
5 Values at the marker position
6 Limit curve of the selected standard
7 Spectrum
Using the marker
⇒
Use the ◄ ► keys to move the marker to the desired position on the measuring
curve.
Using the peak marker
The highest spectral lines can be evaluated via the peak marker.
✓ The peak marker can only be selected after the display has been stopped.
⇒ For information on the peak marker, see 10.7 Peak marker on page 106.
1
2
3
5
7
6
4