8.6 Shaped Time Domain
Narda FieldMan 87
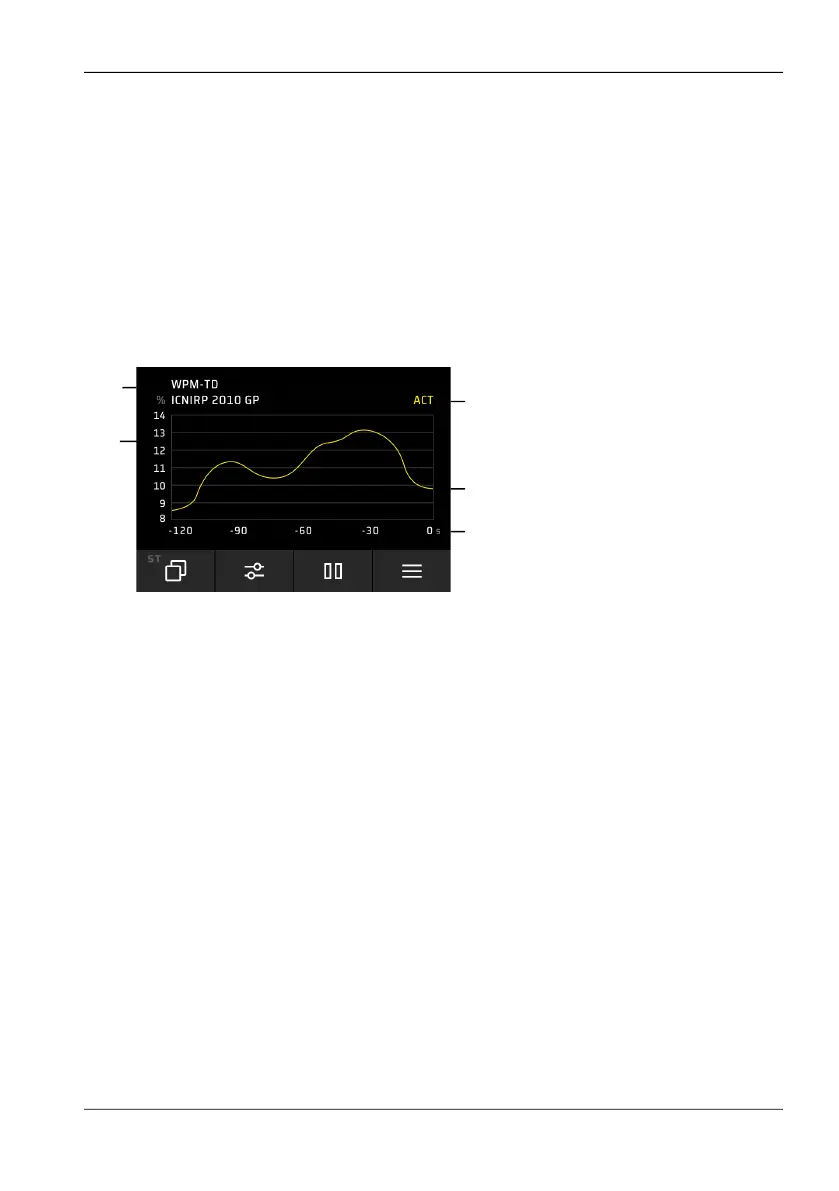
8.6.4 Time curve display
The time curve graph represents the isotropic result of the exposure index running from
right to left with a rolling memory.
Activate the time curve display:
⇒ MEASUREMENT SETTINGS: Activate Time Curve.
↳ Since the curve memory is always active in the SHAPED TIME DOMAIN operat-
ing mode (even with Time Curve = Off), the complete curve progression since the
last operating mode change or reset appears immediately.
Fig. 15: Time curve display in the SHAPED TIME DOMAIN operating mode
1 Selected standard
2 Measured values in % of standard
3 Result type
4 Time curve of the measurement
5 Time axis
3
1
2
5
4